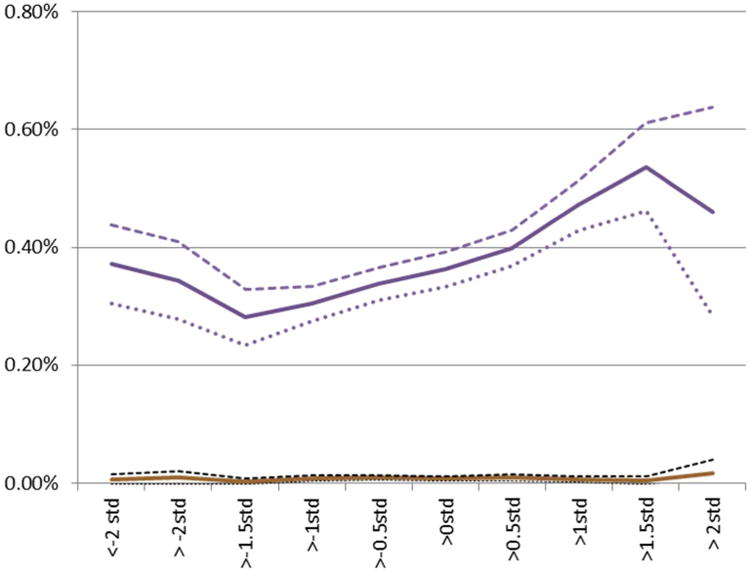
Figure 2.

Bulimia prevalence (y axis: females, blue line, and males, red line) by school achievement (x axis). Note: dashed lines represent the upper 95% confidence limit; dotted lines represent the lower 95% confidence limit. Std = standard deviation.
