
Fig. 1.
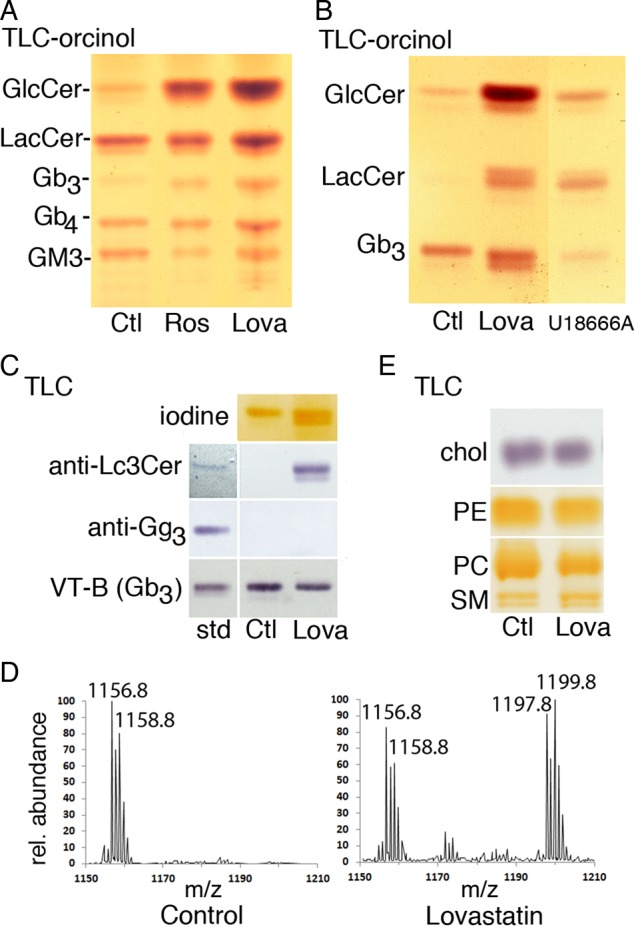
Statins increase GlcCer and Lc3Cer in A431 cells. (A) Total GSL extracts from 106 A431G cells cultured with Crestor™ pill extract (theoretical rosuvastatin concentration 20 µM) or 5 µM lovastatin for 72 h were separated by TLC in solvent C and detected by orcinol spray for carbohydrate. Migration of standards is indicated; GlcCer, lactosylceramide, Gb3 and Gb4 (globo-series GSLs, globotriaosyl or tetraosylceramide, respectively), GM3 (monosialoganglioside). Statins substantially increase GlcCer and a ceramide trihexoside. (B) Neutral GSLs from A431S cells grown ± 10 µM lovastatin or U18666A for 48 h were separated in solvent B and detected with orcinol. GSL changes induced by U18666A are distinct from statin effects. (C) The TLC trihexoside region is shown; A431S cells were treated with lovastatin or vehicle control as in (B), then TLC plates were probed with anti-Lc3Cer, anti-Gg3, or VT1 B-subunit for Gb3. Antibody–ligand binding to standard GSLs is shown left. (D) MALDI MS of neutral GSLs of A431S cells treated as in (B). The ceramide trihexoside (Gb3) C24:1/24:0 fatty acid region is shown, and sodiated peaks for C24:0 (m/z 1158.8) and C24:1 (1156.8) are labeled. On lovastatin treatment, the sodiated C24:0/C24:1 peaks of Lc3Cer are apparent (m/z 1199.8/1197.9, respectively). (E) TLC analysis of cholesterol and phospholipid fractions of A431S cells treated as in (B). Lipids were identified by co-migration with standards. Cholesterol from 2 × 10⁵ cells was run in solvent D and detected with FeCl3 spray; PE, PC, and SM from 5 × 10⁵ cells run in solvent B were detected by iodine vapor. This figure is available in black and white in print and in colour at Glycobiology online.