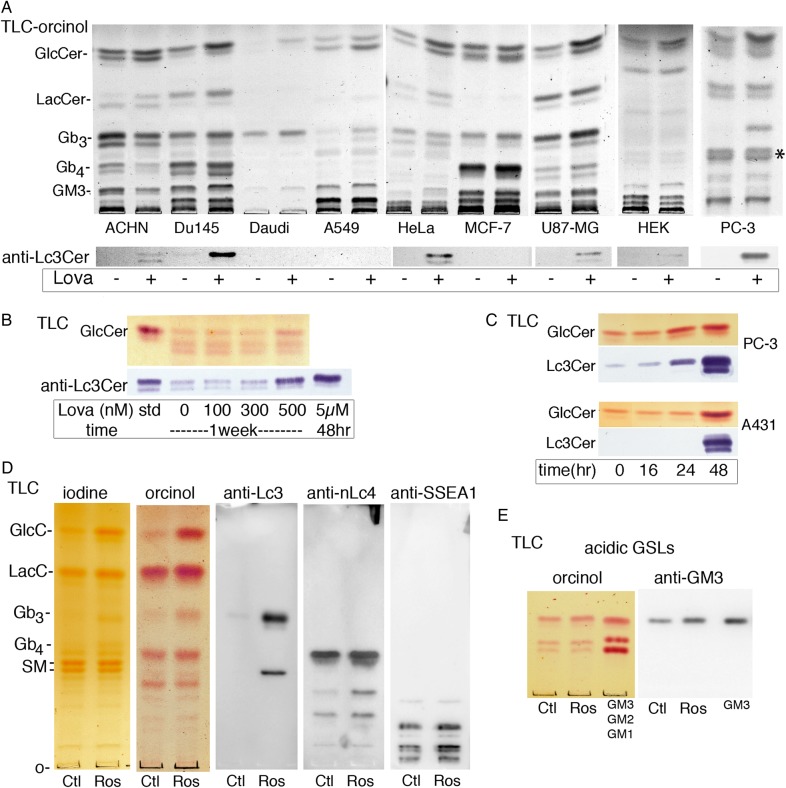
Fig. 2.
Lovastatin elevates GlcCer in all cell lines tested. (A, upper panel) Total saponified lipids, from cells treated 48 h ± 5–10 µM lovastatin, were separated by TLC in solvent B. GSLs are detected by orcinol spray, migration of standards is shown on left. GlcCer is increased in all cell lines tested. (A, lower panel) TLC immunoblot; replicate plate probed with anti-Lc3Cer shows increased/induced Lc3Cer in ACHN, DU145, HeLa, U87MG, HEK, and PC-3 cells. (B) Long-term, low-dose lovastatin titration in PC-3 cells shows both GlcCer and Lc3Cer (detected with orcinol and anti-Lc3Cer, respectively) are elevated at 500 nM lovastatin dose. (C) Time course treatment with 10 µM lovastatin. GSL changes are apparent at 24 h in PC-3 cells and 48 h in A431S cells. GSLs from 106 cells separated by TLC in solvent (C). (D) Identification of slow-migrating lactosamine-containing species. Total neutral GSL fraction from A431G cells treated 48 h ± 20 µM rosuvastatin was separated by TLC in solvent C and probed with anti-Lc3Cer (MAC-1; terminal GlcNAcβ1-3Gal), anti-nLc4 (FE-A5; terminal Galβ1-4GlcNAcβ1-3) or anti-SSEA1 (Lewis × determinant; Galβ1-4(Fucα1-3)GlcNAcβ1-3). (E) Identification of GM3 in A431G cells. The acidic fraction of cells from panel (D) was detected with orcinol or probed with mAb anti-GM3 (clone DH2). Three major acidic GSLs were detected including GM3, which was increased in statin-treated cells. This figure is available in black and white in print and in colour at Glycobiology online.

