Fig. 3.
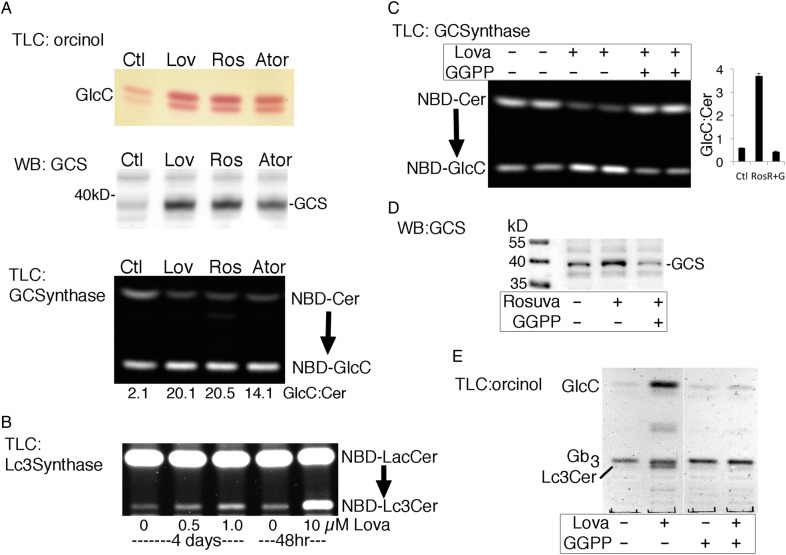
Statin-induced increase in GlcCer results from prenylation-dependent GCS elevation. (A) ACHN cells were cultured with 10 µM lovastatin, 20 µM rosuvastatin or 10 µM atorovastatin for 48 h. GlcCer was detected by TLC/orcinol (upper panel), GCS by western blot (middle panel; 20 µg protein lysate) and GCS enzyme activity was monitored by conversion of NBD-Cer to NBD-GlcCer (bottom panel; 3 h reaction, GlcCer:Cer band intensity ratios are shown). (B) Lc3Cer synthase activity, monitored by conversion of NBD-LacCer to NBD-Lc3Cer, increased in lysates of PC-3 cells treated with low dose (0.5 or 1.0 µM) lovastatin for 4 days, or acute treatment (10 µM, 48 h). (C) ACHN cells were treated with 20 µM rosuvastatin ± 10 µM GGPP for 48 h and analyzed for GCS enzyme activity. Bar graph shows average GlcCer:Cer ratio±range of duplicate samples. (D) Western blot of ACHN cell lysates, treatment as in (C). (E) TLC analysis of GSLs from A431S cells treated with vehicle control or 10 µM lovastatin ± 10 µM GGPP for 48 h (orcinol detection). This figure is available in black and white in print and in colour at Glycobiology online.

