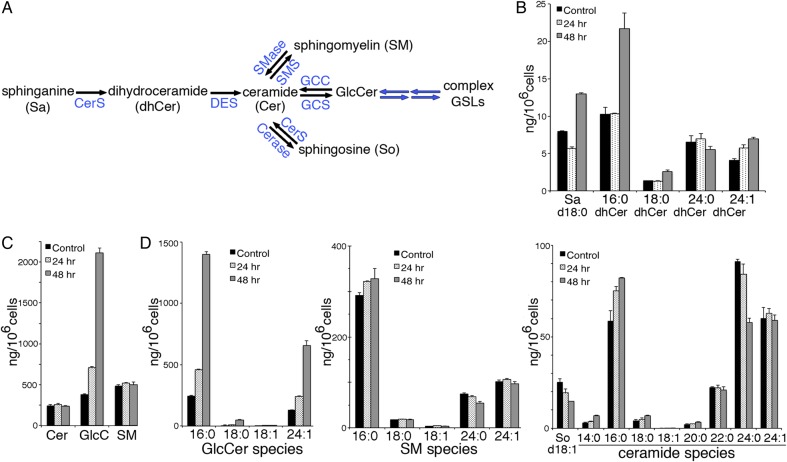
Fig. 4.
Effect of statin treatment on sphingolipid metabolite levels. (A) Summary of sphingolipid metabolism pathways. CerS, ceramide synthases 1–5, which vary in fatty acid chain length preference; DES, dhCer desaturase; SMS or SMase, sphingomyelin synthase or sphingomyelinase, respectively; Cerase, ceramidase; GCC; glucocerobrosidase (cytosolic and lysosomal forms). Extracts of ACHN cells treated with 20 µM rosuvastatin for 0, 24 or 48 h were analyzed by quantitative LC–MS-MS for; (B) precursor Sa and dhCer species and (C) total Cer, GlcCer and SM. In (D) the individual fatty acid species for Cer, GlcCer and SM are shown. Quantitative measurement of some species was not available at the time of analysis; all species analyzed are shown. Bar graphs represent average ng/106 cells ± range of duplicate samples divided by two. This figure is available in black and white in print and in colour at Glycobiology online.

