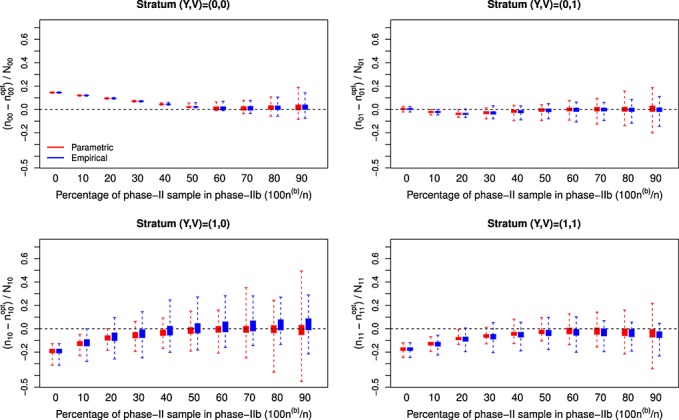
Figure 1.

Empirical differences in sampling fractions between the asymptotically-optimal design and the two-stage adaptive designs employing proportional stratified sampling in phase-IIa according to the percentage of the phase-II sample that is selected at phase-IIb (n(b)/n) for a binary expensive covariate; N = 800; n = 200; (β0,βx,βv) = (−1.95,1.00,0.90), (α0,αv) = (1.05,−0.41), and γ0=−0.04 ; nYV represents the number of individuals selected for the measurement of X from the available NYV individuals in stratum (Y,V) in the two-stage adaptive design, while represents the corresponding sample size for the asymptotically-optimal design. This two-stage adaptive design was derived for selecting individuals for measurement of a binary X and relied on either parametric or empirical estimation of design components from data collected in phase-I and phase-IIa.
