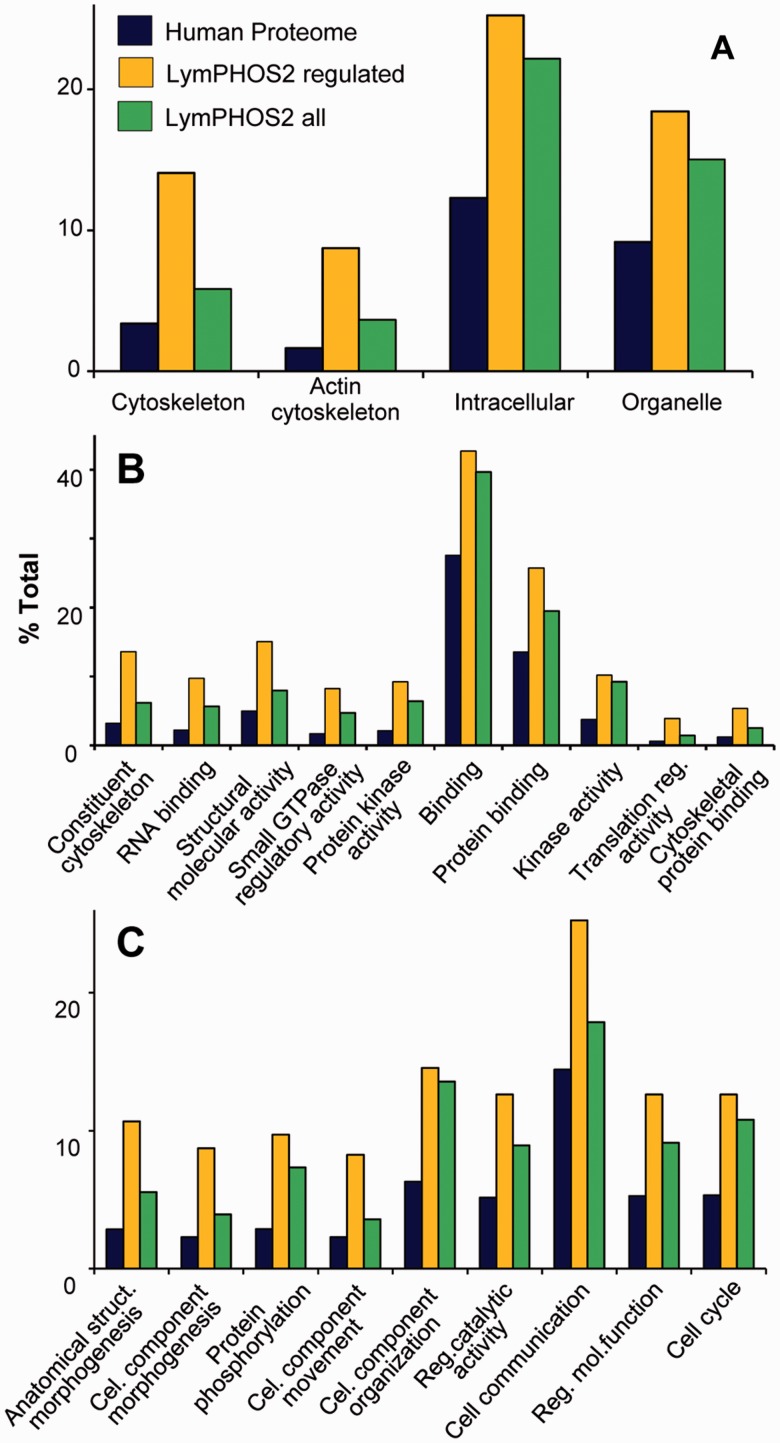
Figure 6.
Gene Ontology (GO) enrichment analysis. Panther Database statistical overrepresentation test for the full LymPHOS phosphoprotein database (green) and the phosphoprotein set containing regulated p-sites (orange) versus the reference human proteome (blue). Classification uses GO-slim terms for cell compartment (A), biological process (B) and molecular function (C). Terms represented are those with enrichment > 1.5 and P < 0.01 for the subset of regulated proteins. Terms are sorted (left to right) by increasing P value (http://pantherdb.org/).

