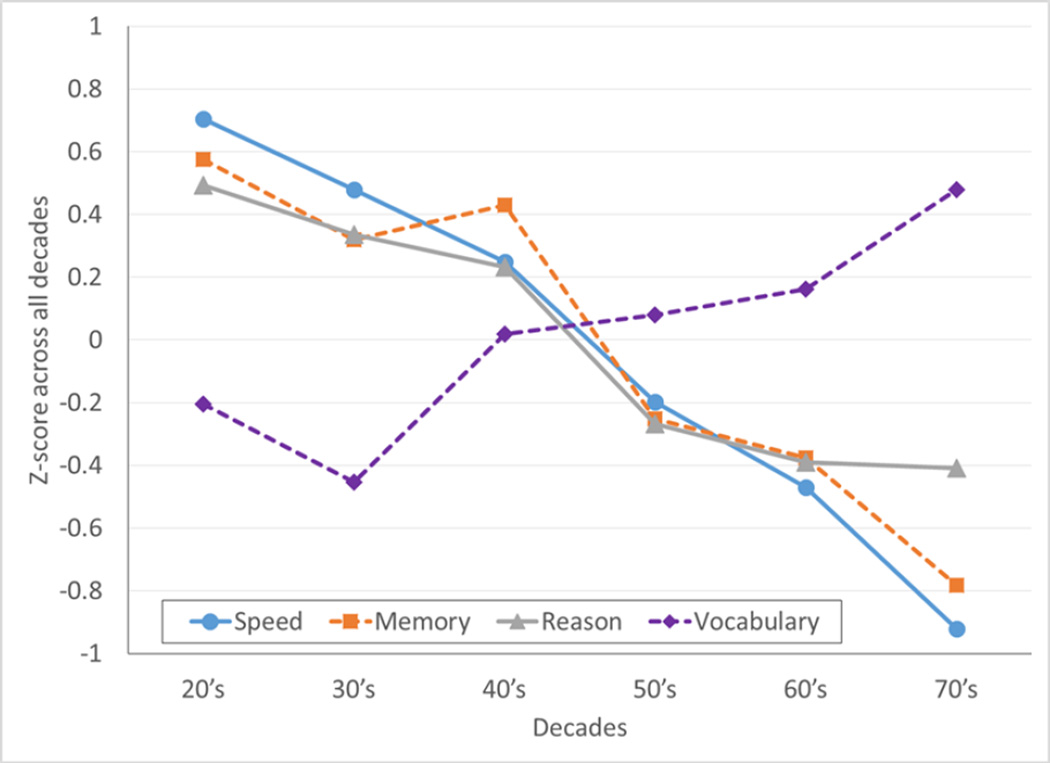
Figure 1.
Mean z-scores for each cognitive ability across decades. Z-scores were calculated across all age groups within each task and then averaged within each decade to show the relative trend in performance across age groups. Solid and dashed lines helped to distinguish the overlapping lines from each other.

