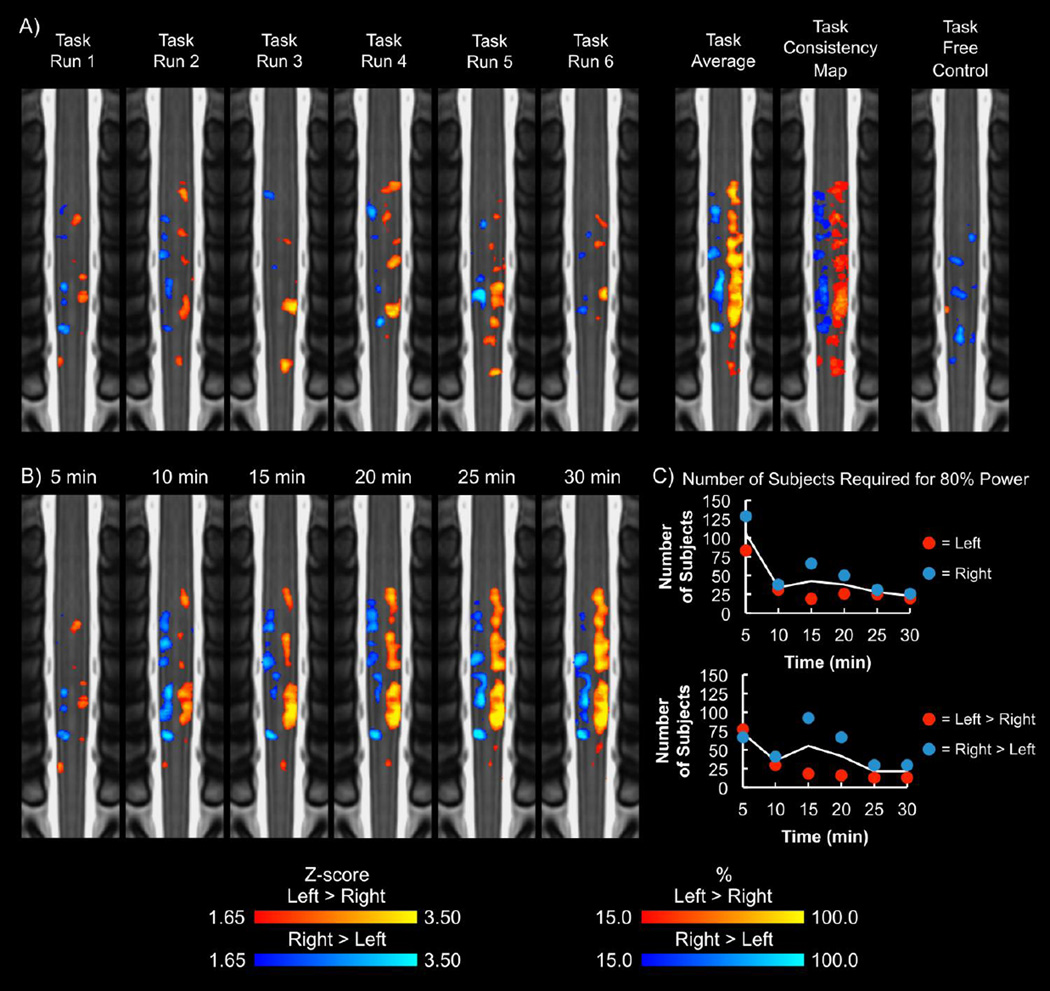
Figure 5.
A) Group average activation maps (coronal slices) for each run of the task for the left > right (yellow-red) and right > left (blue-light blue) contrasts. For each run of the task, the activity was primarily localized to the hemicord ipsilateral to the task. The average group activity and consistency maps across the six runs were calculated for comparison. The average group activity and consistency maps demonstrated lateralization of the activity to the corresponding hemicord. In comparison, the task free control resulted in areas of activity, but the activity was not localized to a specific region of the spinal cord. The activation maps were thresholded at a Zscore > 1.65 with no cluster thresholding. The task consistency map shows the percentage of the six task runs that a voxel was active. B) Group average activation maps for increasing lengths of the time series are shown. Overall, the activity detected appears to remain consistent after 20 min of data collection. The group average activation maps were thresholded at a Z-score > 1.65 with no cluster thresholding. C) The number of subjects required for 80% power to detect activity in the ipsilateral hemicord at the C6 vertebral level was calculated for each time series length. The solid line represents the average of the contrasts. At 30 min, the left and right contrasts required 20 and 26 subjects, respectively, for 80% power, while the left > right and right > left contrasts required 13 and 30 subjects, respectively.

