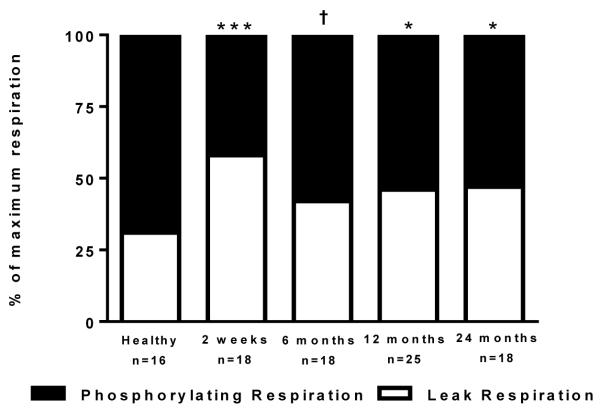
Figure 4.
The flux control ratio (FCR) and flux control factor (FCF) for oligomycin are shown in Figure 4. The FCR, shown as phosphorylation and the FCF, shown as thermogenesis, are graphed as a percentage of maximal state 3I+II respiration. *P<0.05 and ***P<0.001 vs. healthy control group. †P<0.05 vs. 2 weeks post burn group. Values are presented as group medians with the interquartile range.

