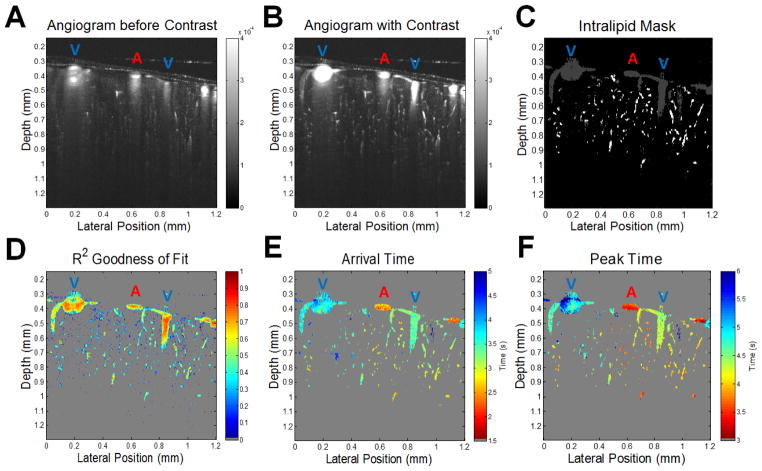
Figure 3.
DyC-OCT cross-sectional mapping of the mouse cortex. Pixel-by-pixel analysis of the DyC-OCT signal following bolus injection of a contrast agent, reveals functional information about microvascular networks in the mouse cortex. Surface arteries and veins, marked with a blue “V” or red “A” respectively, were identified prior to DyC-OCT imaging through inspection of an enface angiogram. A–B) Intralipid (contrast) injection significantly increases the angiogram signal in the vasculature in the imaged cross-sectional plane. C) The gray and white masks show where the increase in angiogram signal exceeded the noise threshold. The white mask represents the vessels that were further analyzed after size and goodness of fit thresholding. Large vessels and noise (gray mask) were rejected. D) Goodness of the model’s fit shows that the best fits correspond to regions with a large signal increase. E–F) The arrival times and peak times of the tracer, extracted from them SOPDT model, separate arteries and veins, and illustrate capillary heterogeneity.

