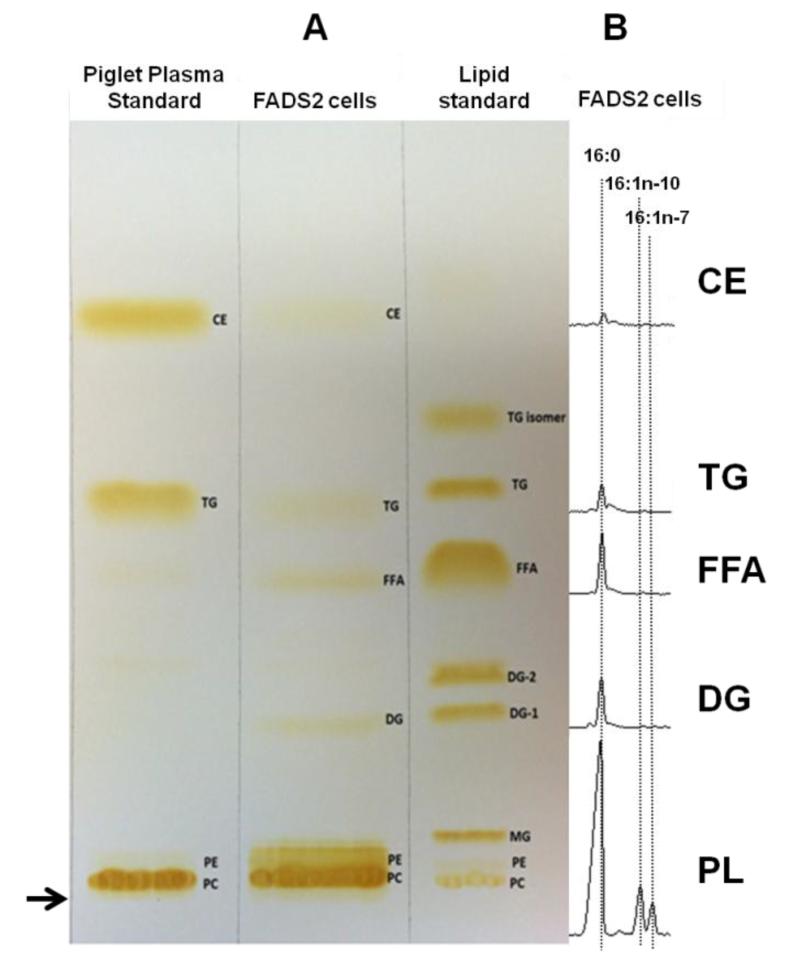
Figure 5.
Thin-layer chromatography of the lipid extracts of the FADS2 cells and the lipid standards. The arrow → denotes the origin. (A) Lipid extracts were loaded onto a 20 × 20 silica gel G plate, developed and visualized by iodine vapor. CE, cholesteryl esters; TG, triglycerides; FFA, free fatty acids; DG, diacylglycerols; PL, phospholipids including phosphatidylethanolamines (PE) and phosphatidylcholines (PC). (B) Each fraction was carefully scrapped and extracted, methylated and analyzed by GC-FID. 16:0 is seen in all fractions. 16:1n-10 and 16:1n-7 are detected only in PL fraction.

