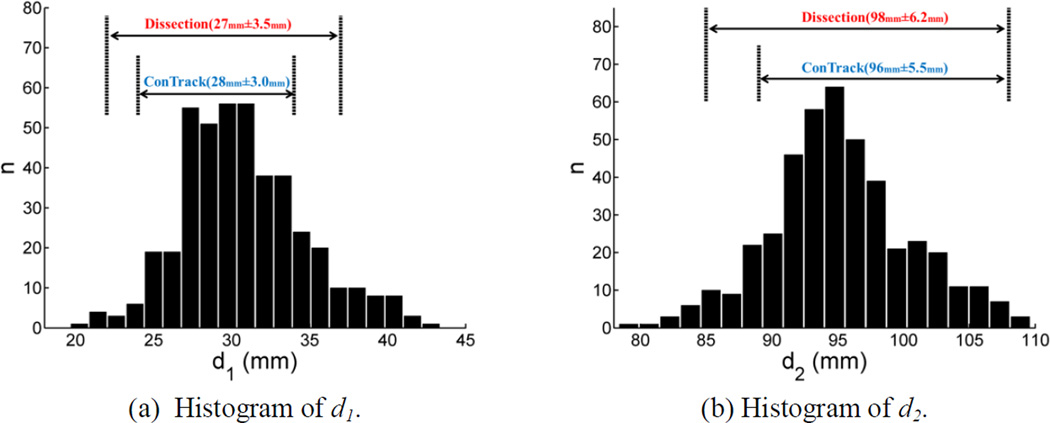
Figure 12.
Histograms of the distances to the temporal and occipital poles calculated from our OR reconstruction were plotted in (a) and (b), respectively. For comparisons, we also plotted the ranges of the distance measures from post-mortem dissection (Ebeling & Reulen, 1988) and the Contrack method (Sherbondy et al., 2008) above the histograms.

