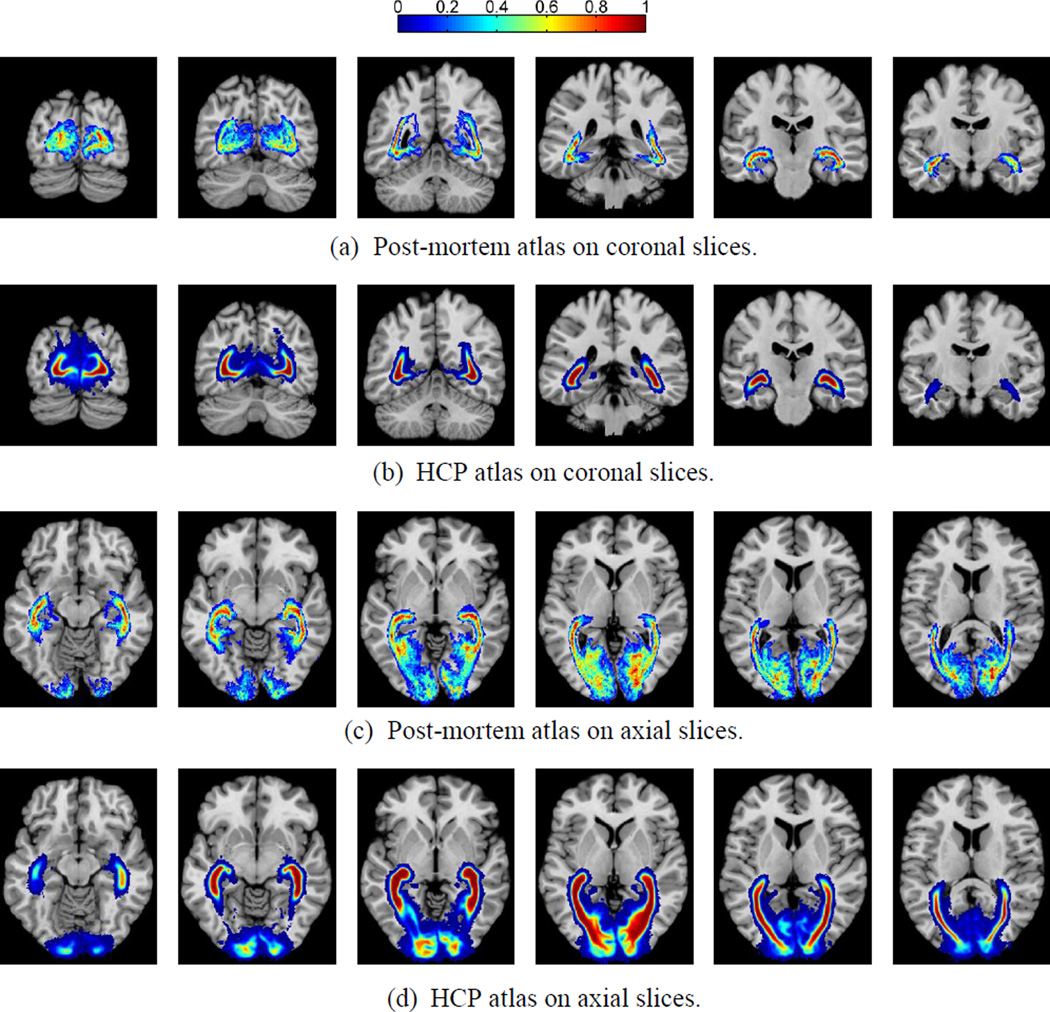
Figure 13.
Probabilistic atlas of the optic radiation constructed from HCP data set as compared to post-mortem data. Results on five coronal and axial slices were plotted to compare with the post-mortem atlas from (Bürgel et al., 1999). (a) Post-mortem coronal; (b) HCP coronal; (c) Post-mortem axial; (d) HCP axial.

