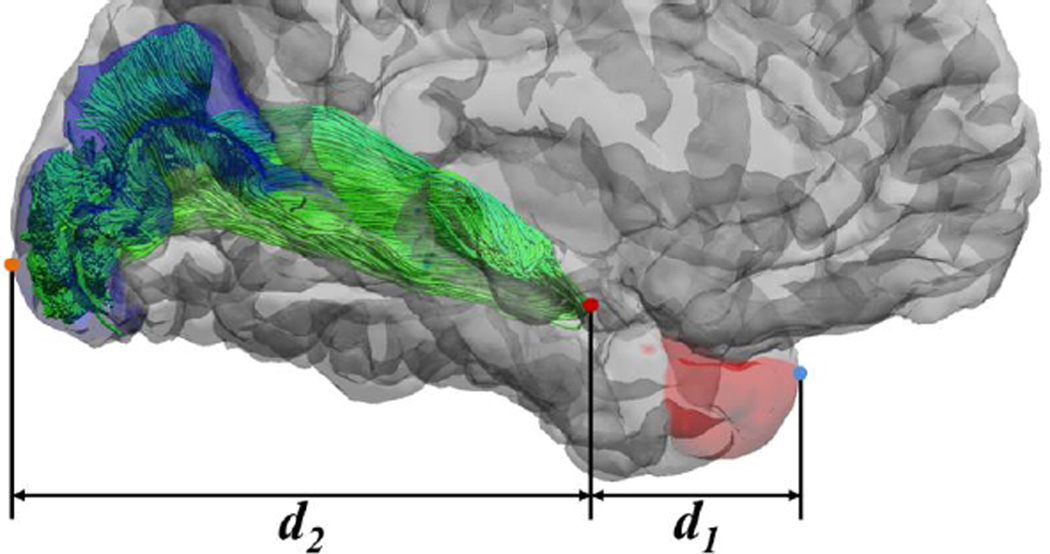
Figure 7.
An illustration of the distances to the temporal and occipital poles. Both the volumetric and dMRI data in HCP are AC-PC aligned. With FreeSurfer, we automatically generate the labels for the temporal pole (red area) and V1 area (blue area), which allows the automated generation of the most anterior point of the temporal pole (blue dot) and the most posterior point of the occipital pole (brown dot). As illustrated above, distances from the most anterior point of the optical radiation (red dot) to the temporal and occipital pole are then calculated to compare with post-mortem results of (Ebeling & Reulen, 1988). Here d1 and d2 denote the absolute difference of the y-coordinate from the tip of the Meyer’s loop to the temporal pole and occipital pole, respectively.

