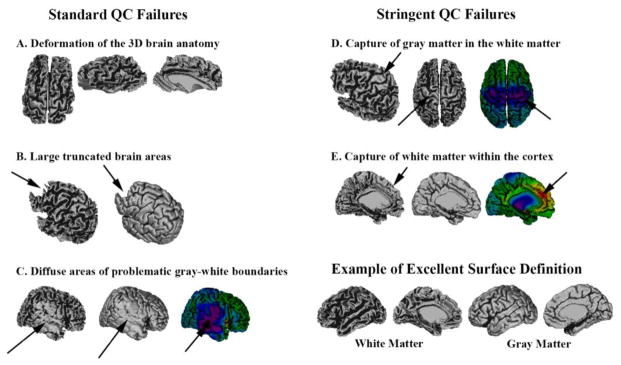
Figure 2.
This figure depicts examples of the different reasons why scans have failed the standard quality control (QC) (left column) or the stringent QC (right column). An example with excellent surface definition is provided for comparison (bottom right). Standard QC Failures: Image A is an example of gross deformation of the overall three-dimensional (3D) shape of the brain. Part B shows a more normal global structure, but with significant parts of the frontal lobes truncated. Image C demonstrates large areas of capture of gray matter in the white matter surface, leading to impaired gyrification and underestimated cortical thickness (blue-purple colors).
Stringent QC Failures: Part D demonstrates the capture of some gray matter within the white matter surface in the pericentral areas (an area with frequent grey-white boundaries problems), but the great majority of the surface is adequately defined. Figure E shows a poor definition of white matter folds in the dorsal medial frontal areas due the capture of some white matter in the cortex, which leads to increased cortical thickness estimations (yellow-red colors). Associated raw MRI images are provided in supplementary materiel (Figure A1)

