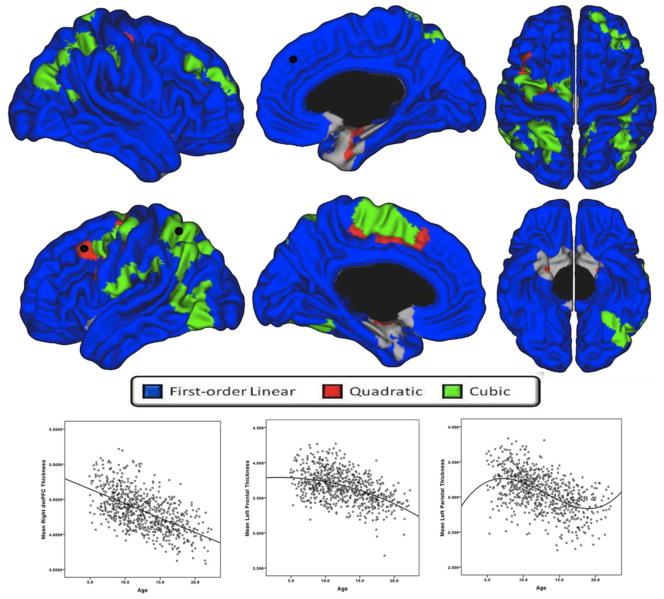
Figure 3.
Developmental trajectories of absolute local cortical thickness (i.e., not controlled for total brain volume) from 4.9 to 22.3 years of age, controlling for sex and scanner (standard QC, n=753). Brain areas for which the best-fit model is cubic are in green, quadratic in red, and first-order linear in blue. Scatterplots of cortical thickness (mm) in representative brain areas (identified with black dot) demonstrating a significant cubic (left plot - left superior parietal cortex), quadratic (middle plot – left caudal middle frontal gyrus) and first-order linear (right plot -dorsomedial prefrontal cortex) trajectory are provided for visualization purpose.

