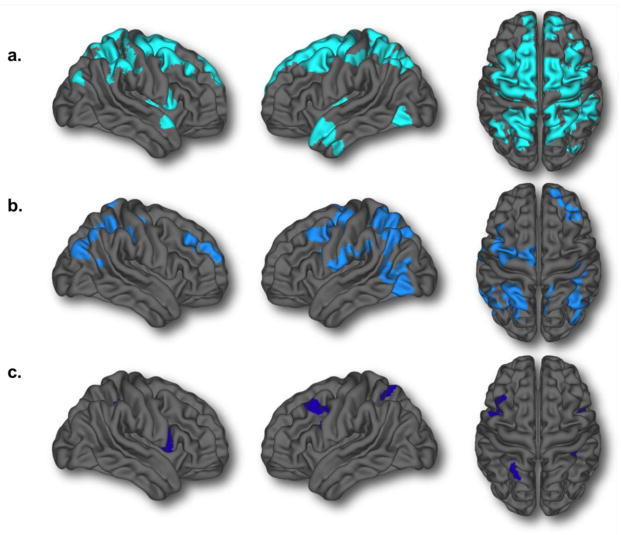
Figure 8.
Brain areas demonstrating either quadratic or cubic developmental trajectories at three levels of quality control: a) no quality control (n=954) [13,435 total vertices; 16.4% of the brain] b) standard quality control (used in the manuscript, n=753) [7,932 total vertices; 9.7% of the brain] c) stringent quality control (n=598) [1,133 vertices; 1.4% of the brain].

