
Figure 1.
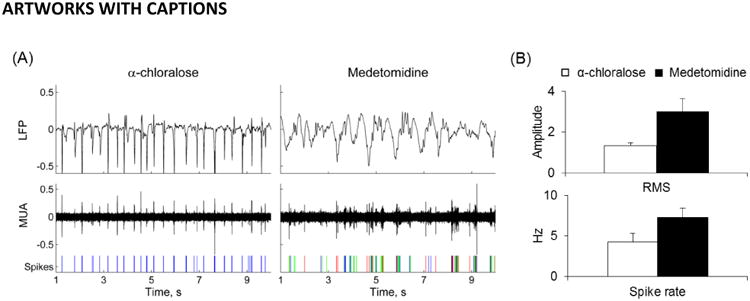
Neural activities for rats anesthetized with α-chloralose vs. medetomidine. (A) LFP and MUA recorded from the S1FL area in rats. Spikes of different classes from MUA are shown on the bottom panel. LFP and MUA under α-chloralose showed a regular though sparser activation pattern compared to medetomidine anesthesia. (B) Root mean square of LFP amplitude (mean±SD) and the spike rate (mean±SD) from MUA recordings for rats with α-chloralose (n=3) and medetomidine (n=3). The α-chloralose group had an LFPRMS of 1.3±0.1 and a spike rate of 4.2±1.1Hz. On the other hand, the medetomidine group had an LFPRMS of 3.0±0.7 and a spike rate of 7.3±1.1Hz. Compared to the α-chloralose group, the neural activity in the medetomidine group was ∼100% higher (p < 0.05).