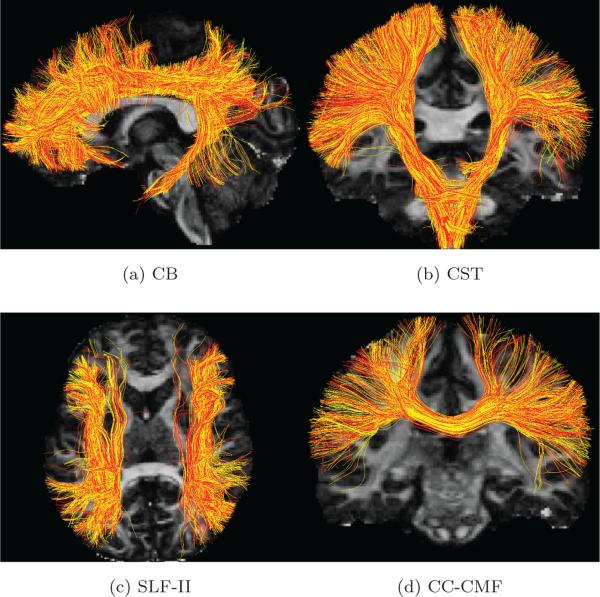
Figure 3.
(a), (b) (c) and (d) are the tractography results for the cingulum bundle (CB), the corticospinal tract (CST), the superior longitudinal fasciculus II (SLF-II) and the corpus callosum caudal middle frontal (CC-CMF) bundle (with red and yellow tracts obtained using the GS data set (with 90 directions) and CS-SRR data set (using 30 directions for thick-slice acquisitions), respectively. The comparison metrics for the fiber bundles are shown in Table 1.

