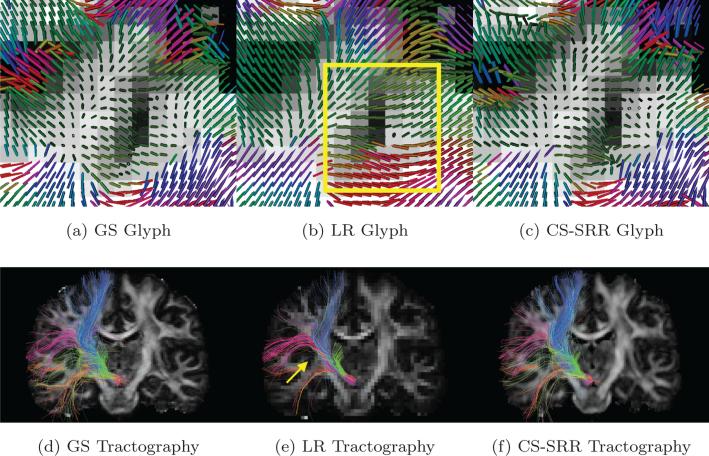
Figure 4.
(a), (b) and (c) show the single tensor glyphs for the GS data set (1.253 mm3 isotropic voxels), LR data set (2.53 mm3 isotropic voxels) and the CS-SRR HCP data sets (1.253 mm3 isotropic voxels), respectively. The rectangle in (b) shows the partial-volume effects in the LR image where the orientations of the glyphs are not estimated correctly. (d), (e) and (f) are the fiber tracts, color-coded with tract orientation for the three data sets with seeds in sub-thalamic nucleus. The arrow points out some missing fiber tracts in the LR image.

