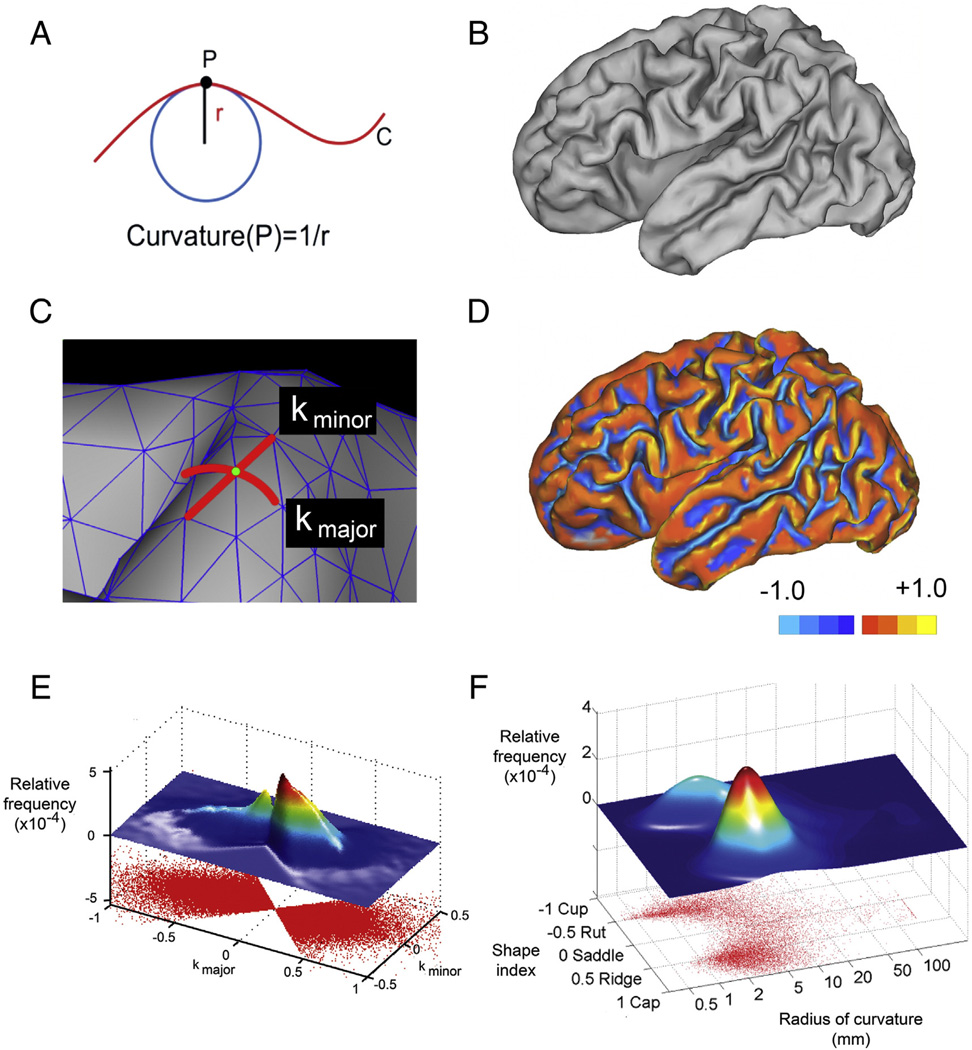
Fig. 1.
(A) An example of measuring curvature at point P on a line. The curvature of point P is determined by the radius of the osculating circle at P. (B) A mid-cortical surface generated using Caret software. (C) An enlargement of the surface showing the surface mesh. The vertices of the mesh are the node points. Note the designation of kmajor and kminor for one of the node points. (D) A mid-cortical surface upon which a color scale representing kmajor is shown. Note that values on gyri are positive while those on sulci are negative. (E) A scatter plot displaying each vertex of a cerebral hemisphere at its kmajor, kminor location. Above that is shown a two-dimensional histogram of the joint frequency distribution — a surface whose z value corresponds to the density of kmajor, kminor points on the scatter plot. (F) A plot of the radius of curvature (on a log scale) vs. shape index. Above that is shown a two-dimensional histogram of the joint frequency distribution.

