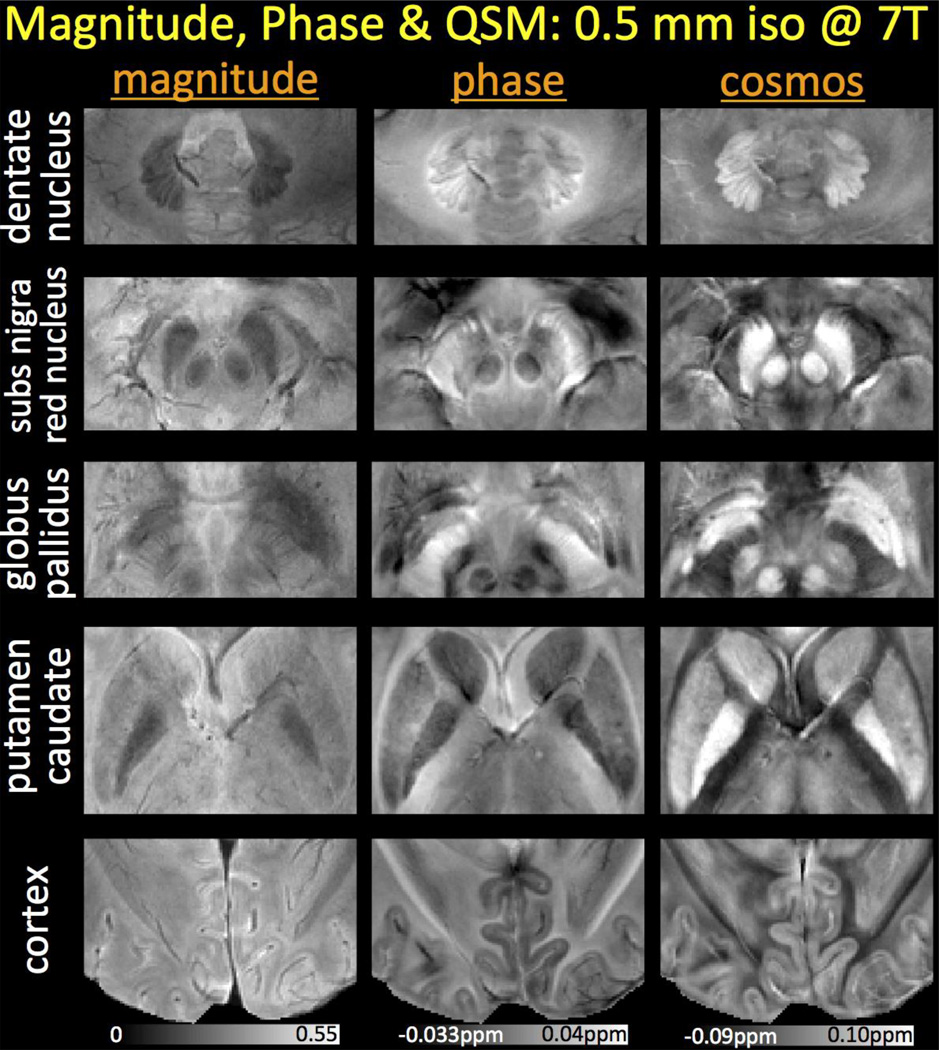
Fig. 3.
Zoomed views of magnitude, phase and susceptibility reconstructions at 7T. While phase and COSMOS yield higher contrast than the magnitude signal, QSM deconvolution further mitigates the non-local dipole effects seen in the frequency maps. This provides the susceptibility images with the ability to depict the cerebellum, basal ganglia and cerebral cortex with superb contrast.

