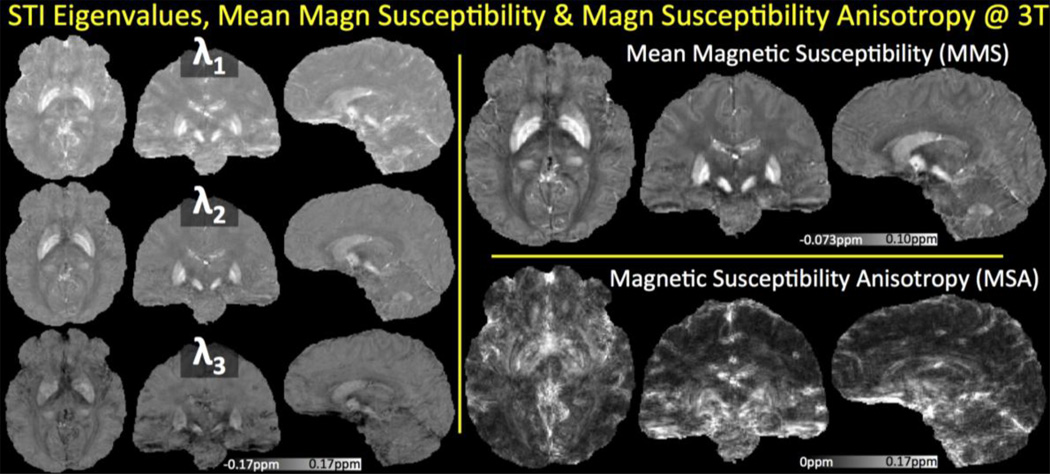
Fig. 6.
Susceptibility Tensor Imaging analysis from 12 orientations at 3T. Tensor eigenvalues are depicted on the left, where the principal component λ1 corresponds to the most paramagnetic eigenvalue. The average of the eigenvalues yielded the Mean Magnetic Susceptibility, while the combination λ1−(λ2+λ3)/2 revealed the Magnetic Susceptibility Anisotropy.

