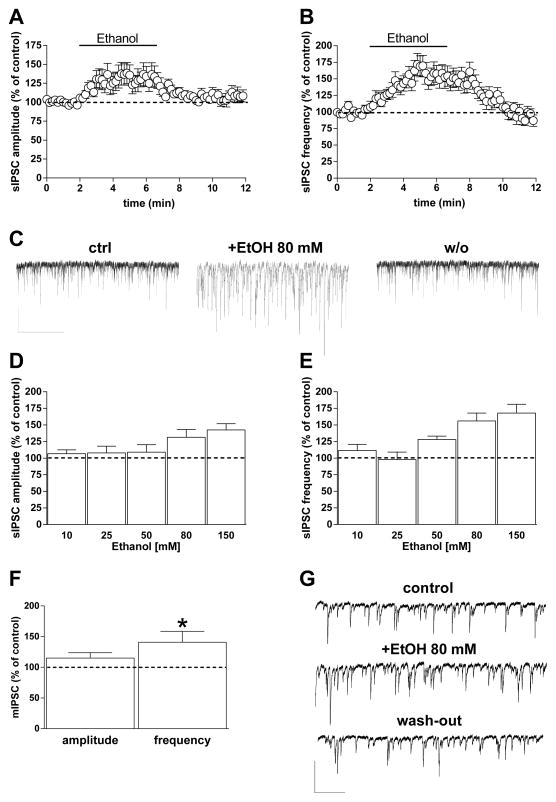
Fig. 1. Ethanol increases GABAergic transmission onto BLA principal neurons.
A, B) Graphs showing the effect of 5-min 80 mM ethanol perfusion on both sIPSC amplitude (A) and frequency (B). C) Representative current traces obtained from a single neuron before, during, and 5 min after ethanol perfusion (scale bar 100 pA, 10 sec). D, E) Bar graph showing the average ethanol effect on sIPSCs at different concentrations (10, 25, 50, 80, and 150 mM). The extent of the ethanol effect was calculated during the 2 min in which the drug showed its maximal effect. Data are expressed as mean ± SEM (n = 5, 9, 11, 27, and 11 cells, respectively). F) Bar graph showing 80-mM ethanol effects on amplitude and frequency of TTX-insensitive sIPSCs (mIPSCs) (n = 11 cells) (*p < 0.05 vs. baseline, paired t test). G) Representative traces of mIPSCs recorded from a single neuron before, during, and after ethanol slice perfusion (scale bar 50 pA, 5 sec).

