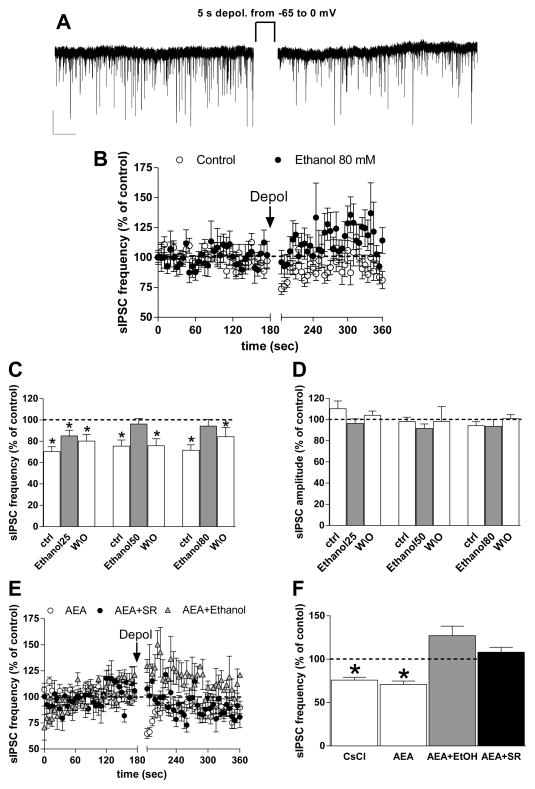
Fig. 5. Depolarization-induced suppression of inhibition in BLA is prevented by ethanol.
A) Representative traces showing that a depolarizing step from −60 mV to 0 mV, applied for 5 sec to a single BLA pyramidal neuron, produced a rapid, short-lasting decrease in sIPSC frequency vs. the baseline-recording period, without any significant modification in amplitude (scale bar 50 pA, 5 sec). B) Graph showing normalized sIPSC frequency over time before, during, and after depolarization using our standard CsCl-containing intracellular solution (open circles) and in the presence of 80-mM ethanol (closed circles) (n =28, 11). C, D) Bar graphs show the average normalized sIPSC frequency (C) and amplitude (D) measured over the first 15 sec after depolarization in control conditions (ACSF only), in the presence of different concentrations of ethanol (25, 50, 80 mM), and after 5 min of ethanol washout (n = 11 for all groups) (*p < 0.05 vs. baseline, paired t test). E) Time course of normalized sIPSC frequency before, during, and after depolarization in recordings made from BLA projection neurons after loading the patch electrode with AEA (10 μM). Recordings were made either in standard aCSF (white circles), aCSF containing SR141716A (1 μM) (gray circles), or aCSF containing 80-mM ethanol (black triangles). (n = 12, 6, 3 cells). F) Summary graph showing DSI magnitude in all CsCl-filled, AEA-filled, AEA + SR and AEA + ethanol cells (n = 28, 12, 6, 3 cells) (*p < 0.05 vs. baseline, paired t test).

