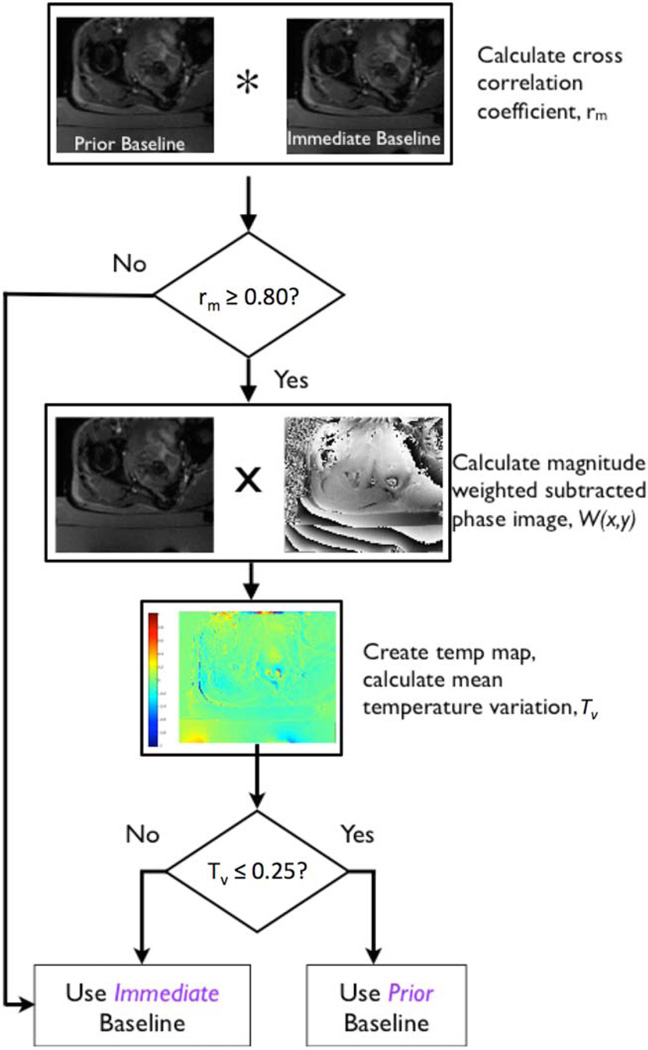
FIGURE 2.
Prior baseline algorithm flow chart. The algorithm compares the similarity of an immediate baseline with a prior baseline to determine if the prior baseline can be used to calculate thermal dose. The decision points are based on similarity of the magnitude images, and overall phase consistency. The 2D cross-correlation criteria excludes baselines where magnitude images are dissimilar due to motion. Phase subtracted images are weighted by the magnitude image to suppress low signal areas, such as background noise outside the patient. The weighted subtracted baseline images are converted into temperature maps. The mean temperature variation criterion excludes baselines with large phase variations.

