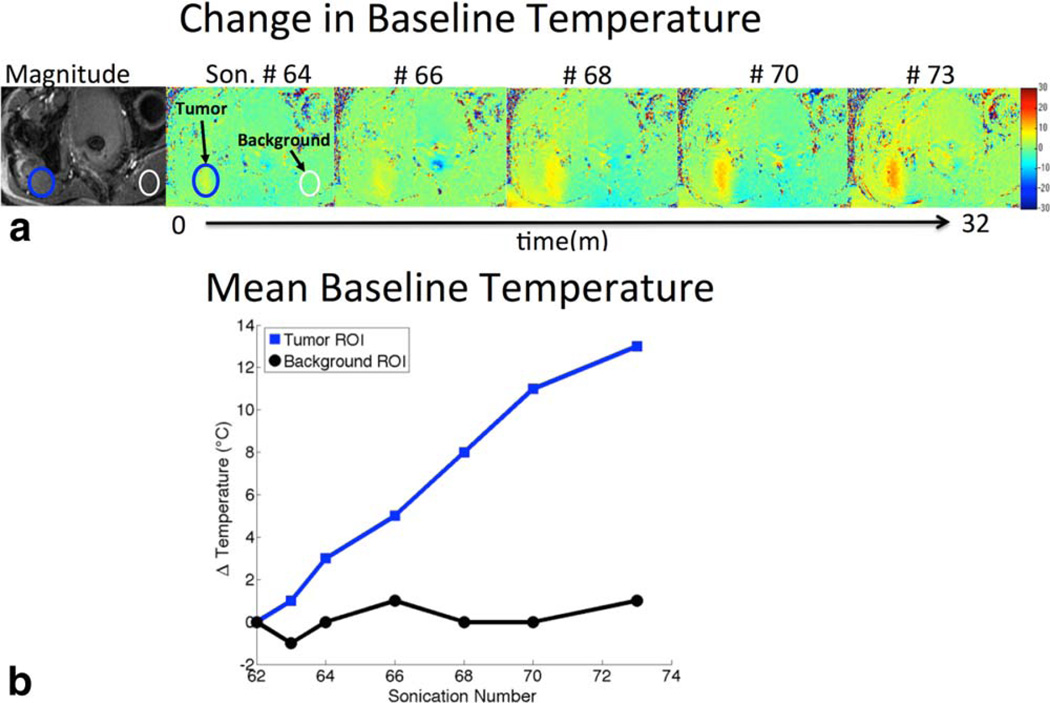
FIGURE 4.
a: Magnitude image of slice location (left). Baseline-to-baseline temperature maps of the same slice location over the course of a patient treatment. Sonication numbers indicated across the top, sonication #60 (not shown) was used as the reference for the subsequent baselines. b: Mean baseline temperatures of region of interests in the tumor, and background (where no heat is applied during the treatment), as a function of sonication number (indicating treatment time). Prior baseline processing shows subsequent preheating baselines in the treatment region do not actually return to body temperature where ΔT = 0°C, as assumed.

