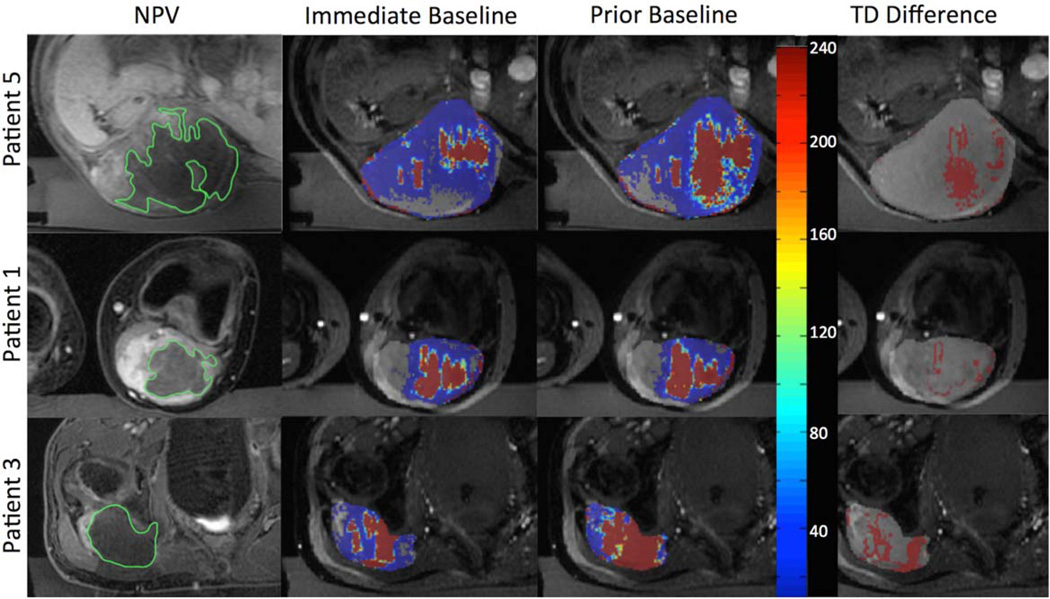
FIGURE 6.
Patient images showing (a) post treatment NPV (green), (b) immediate baseline (red), and (c) prior baseline treatment contours (red) for three patients. Column (d) is the additional dose calculated due to the prior baseline method. Gray overlay in columns (b–d) indicates general region of treatment.

