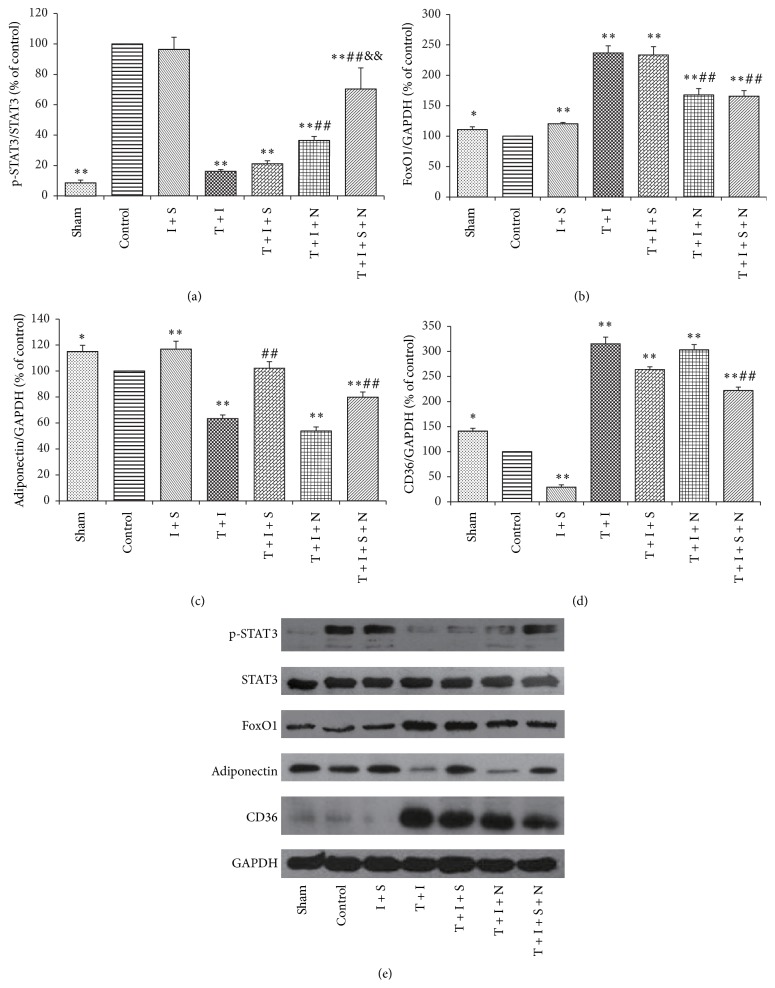
Figure 3.
Expression of myocardial p-STAT3 (a), FoxO1 (b), adiponectin (c), CD36 (d), and pictorial diagram of western blots (e) after myocardial IR. Heart tissues were stored at −80°C right after reperfusion. Data was expressed as mean ± SEM (n = 6 per group). I, T, S, and N, respectively, stand for ischemia-reperfusion (I), Type 1 diabetes (T), sevoflurane (S), and N-Acetylcysteine (N); control: ischemia-reperfusion untreated group. ∗ P < 0.05; ∗∗ P < 0.01 compared with control group; ## P < 0.01 compared with T + I group. && P < 0.01 compared with T + I + N group.

