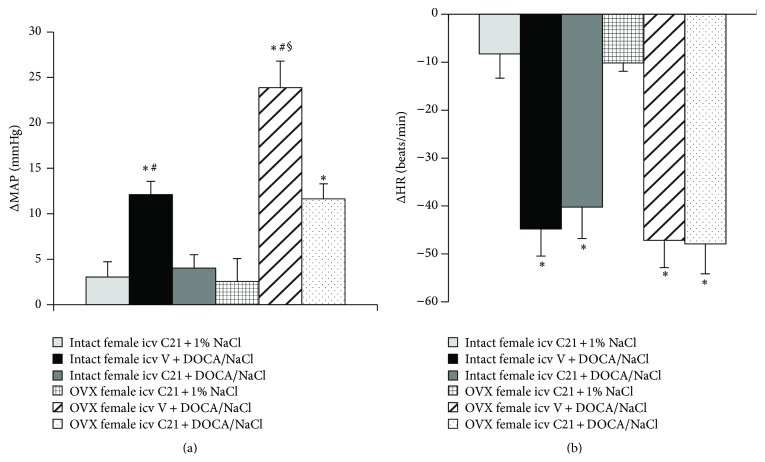
Figure 3.
Average changes in MAP (a) and HR (b) produced by DOCA/NaCl treatment in intact and OVX female rats. n = 6 per group; ∗ P < 0.05 compared to intact or OVX females with central infusion of C21 alone; # P < 0.05 compared to intact or OVX females with central C21 plus DOCA/NaCl; § P < 0.05 compared to intact females with DOCA/NaCl.

