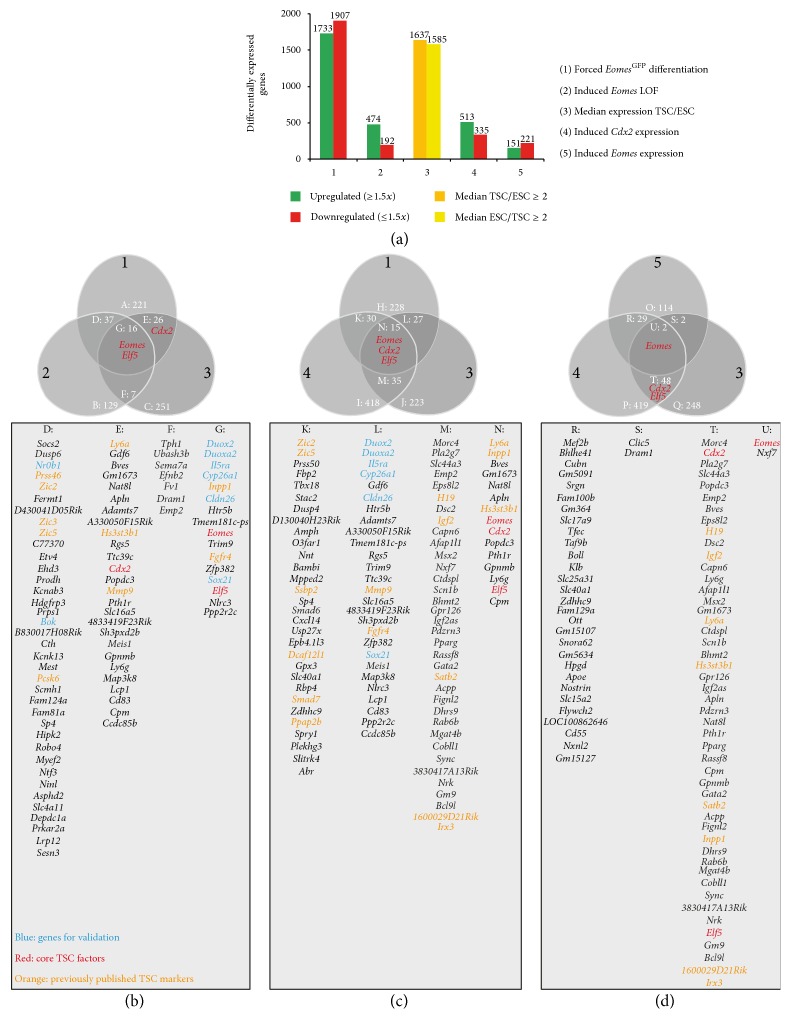
Figure 4.
Comparative gene expression analysis reveals candidate TSC marker genes. (a) Genome-wide expression analysis generated five data sets of differentially expressed genes resulting from different experimental settings as shown in Figure 3. (1) The first group contains regulated genes after 3 days of differentiation of Eomes GFP-high FACS-enriched TSCs when compared to undifferentiated Eomes GFP-high TSCs. (2) The second group represents differentially regulated genes 3 days following Eomes gene deletion in TSCs (LOF, loss-of-function). (3) The third group comprises genes which show significantly increased or decreased median expression in TSCs versus mES cells, (4, 5) and the fourth and fifth group are differentially expressed genes 2 days after induced expression of Cdx2 or Eomes, respectively. The bar chart indicates numbers of differentially expressed genes for each gene group. (b–d) Venn diagrams indicate groups of intersecting, differentially expressed genes. The genes of resulting groups are listed in the table below each Venn diagram. (b) Comparison between the 300 most strongly downregulated genes in differentiating Eomes GFP FACS-enriched TSCs, the 189 genes downregulated following Eomes deletion, and the 300 genes with highest expression ratio between TSCs and mES cells. Of note, Cdx2, Eomes, and Elf5 expression levels decrease during TSC differentiation. The loss of Eomes function does not significantly reduce Cdx2 expression after 3d. In (c) the set of differentially regulated genes after Eomes gene deletion was exchanged with those 498 genes that were upregulated following Cdx2-induction in mES cells. In (d) genes that were induced by Eomes or Cdx2 expression in mES cells were compared to 300 genes with the highest expression ratio in TSCs versus mES cells. Note that Eomes is neither significantly upregulating Elf5 nor Cdx2 expression. Differences in number of genes listed in (a) and in (b–d) result from genes with multiple transcripts but identical gene symbols. The selected cut-off criteria for genes to be included in datasets were a positive or negative fold change ≥ 1.5 in response to treatment and a p value ≤ 0.05. Genes selected for further analyses are highlighted in blue, core genes of the TSC positive feedback loop in red, and genes that were previously identified as TSC markers in orange.

