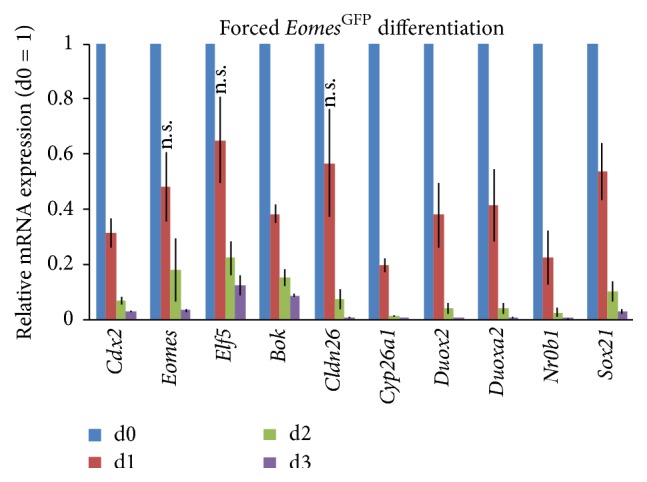
Figure 5.

Genes identified by expression arrays and comparative analyses are downregulated during TSC differentiation when validated by qPCR. mRNA expression levels for genes selected by dataset comparisons were quantified at 24 h intervals by qRT-PCR of undifferentiated FACS-enriched Eomes GFP-high TSCs at day 0 (d0) and after forced differentiation for three days (d1–d3). Expression levels are depicted as means of biological triplicates relative to d0, which was set to 1. All genes were significantly (p value ≤ 0.05) downregulated at different time points unless indicated otherwise (n.s., not significant). Error bars indicate the standard error of the mean. p values were calculated according to two-sided Student's t-test. All marker genes show grossly reduced expression during the course of 3 days of differentiation.
