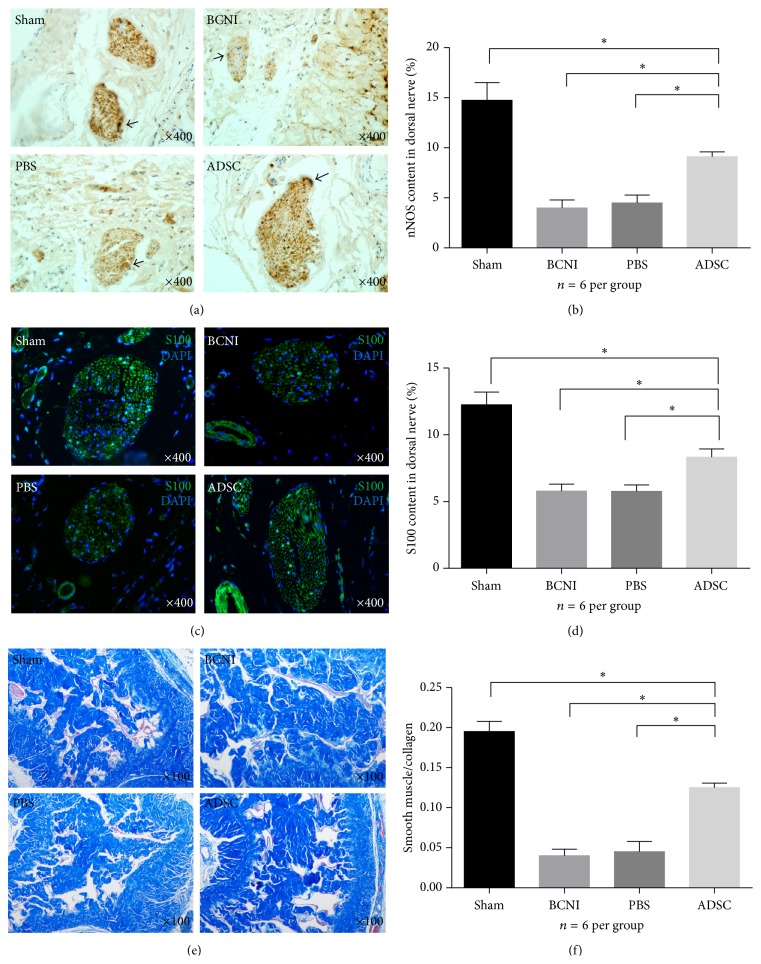
Figure 6.
Histomorphometric Analysis of Penile Tissue. (a) Representative images are presented for the nNOS-positive fibers (black arrow indicated) in the penile dorsal nerves of each experimental group via immunohistochemical analysis. Original magnification is ×400. n = 6 per group. (b) Quantitative analysis of the nNOS-positive fibers to the total area of penile dorsal nerves in pixels calculated by Image-Pro Plus 6.0 software at a magnification of ×400. ∗ P < 0.05. (c) Representative images of the S100-positive fibers in the penile dorsal nerves of each experimental group via immunofluorescence analysis. Original magnification is ×400. n = 6 per group. (d) Quantitative analysis of the S100-positive fibers to the total area of penile dorsal nerves in pixels calculated by Image-Pro Plus 6.0 software at a magnification of ×400. ∗ P < 0.05. (e) Representative images of the penile tissue stained with Masson's trichrome in all experimental groups. Smooth muscle is stained red, and collagen and connective tissue are stained blue. Original magnification is ×100, n = 6 per group. (f) The ratio of smooth muscle to collagen and connective tissue area in the corpus cavernosum was calculated in each group. ∗ P < 0.05. nNOS = neuronal nitric oxide synthase.

