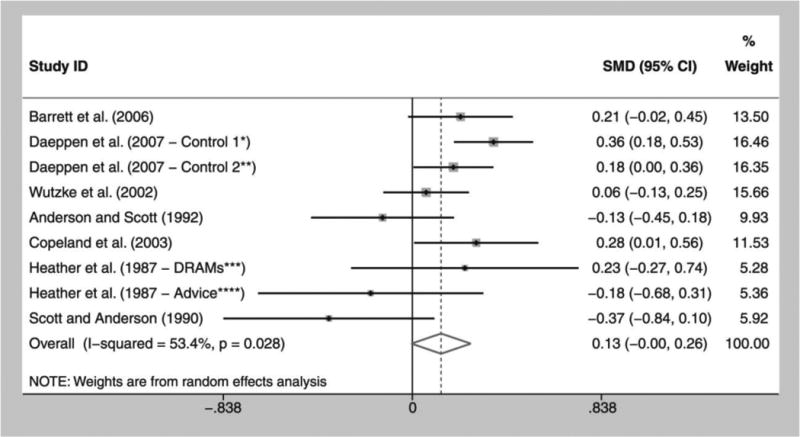
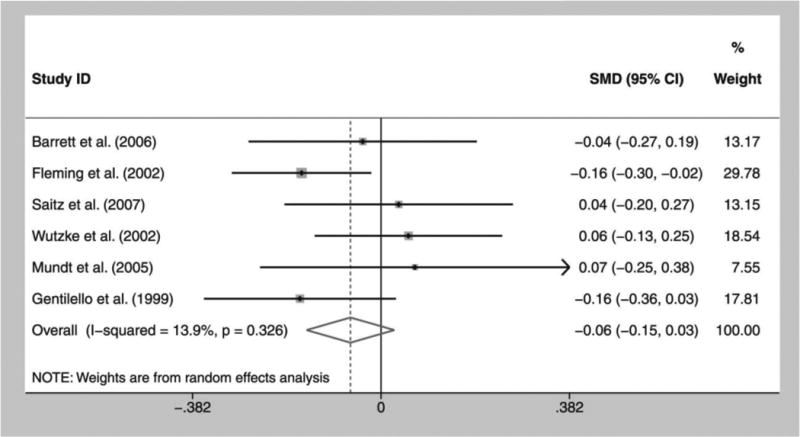
Figure 1. Meta-analytic results for outpatient and ED care.


Figure 1a. Outpatient care forest plot
Figure 1b. Emergency department care forest plot
Figure 1a and 1b Legend: *Control 1: Intervention vs. control with assessment
**Control 2: Intervention vs. control without assessment
***Drinking reasonably and moderately with self-control (DRAMs): DRAMs scheme vs. control
****Advice: Simple advice vs. control
Caption: Effect sizes are Hedges d (i.e., within-group effect sizes) with random effects. Error bars represent 95% confidence intervals. The I-squared statistic measures heterogeneity across estimates.
