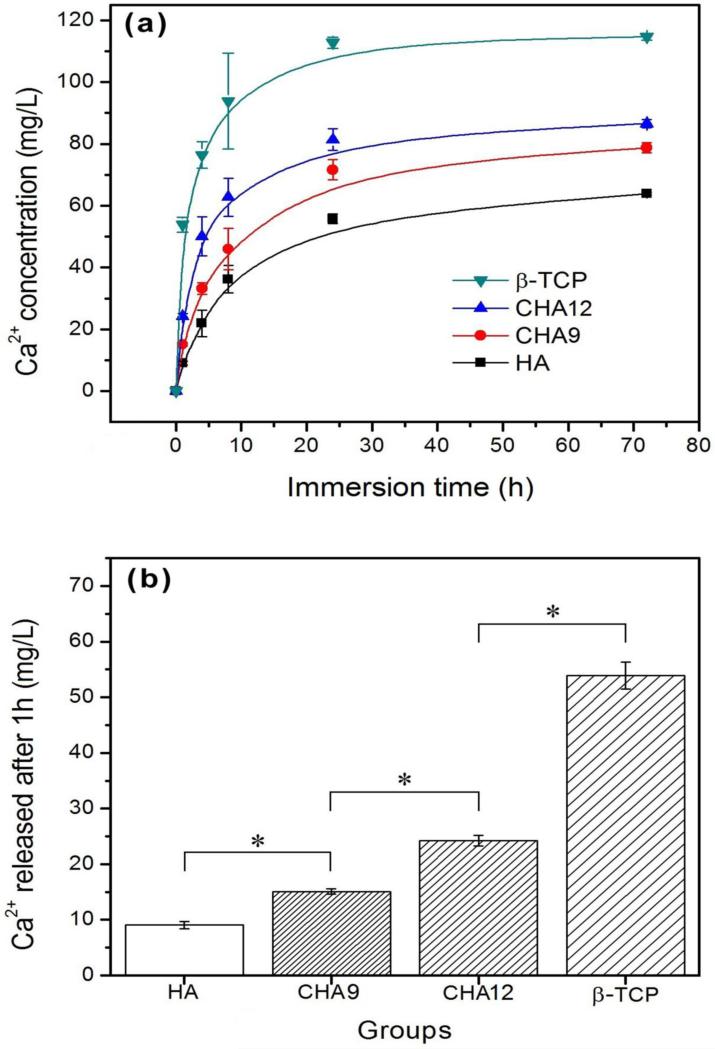
Fig. 3.
(a) Cumulative amount of Ca2+ ion released from hollow HA, CHA9, and CHA12 microspheres into 0.1 M potassium acetate buffer solution (pH = 5.0; 37 °C) as a function of immersion time. (b) Amount of Ca2+ ions released from the three groups of microspheres after 1 h in the buffer solution. For comparison, the release of Ca2+ ions from a β-TCP reference material is also shown. (*significant difference between groups; p<0.05)

