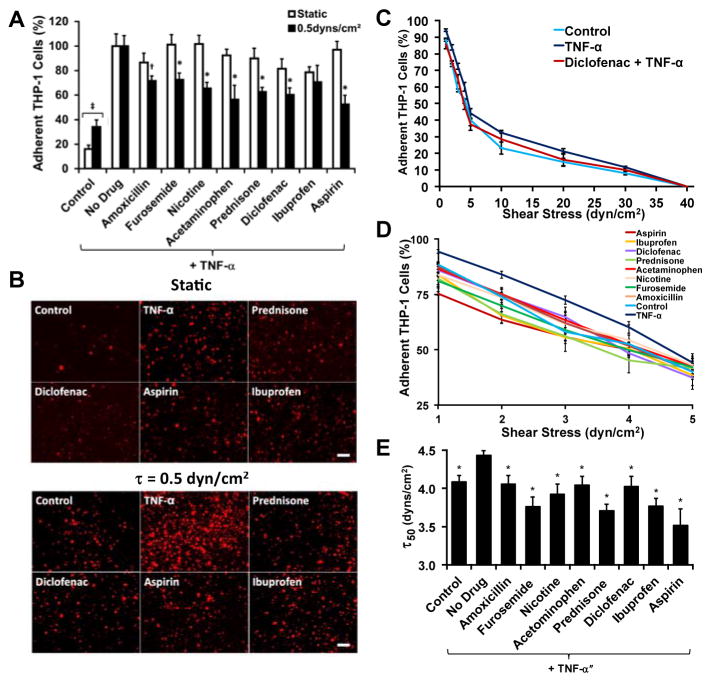
Fig 2.
Validation of the assay with a drug screen using known anti-inflammatory compounds. (A) THP-1 cells were fluorescently labeled and flowed over a monolayer of confluent endothelial cells for 15 minutes. *p < 0.05 versus static assay and versus TNF-α treated cells; +p < 0.05 versus TNF-α treated cells. (B) Fluorescent images of cells adhered to the plate under the various anti-inflammatory cells. Bar = 100 μm. (C) Overall de-adhesion assay for the THP-1 cells under anti-inflammatory treatments. (D) Low shear stress range for the de-adhesion assay. (E) Shear stress under which 50% of the cells are lost from the surface (τ50), calculated from a logarithmic fit to the detachment curves. *p < 0.05 versus TNF-α only (“No Drug”) treatment group.

