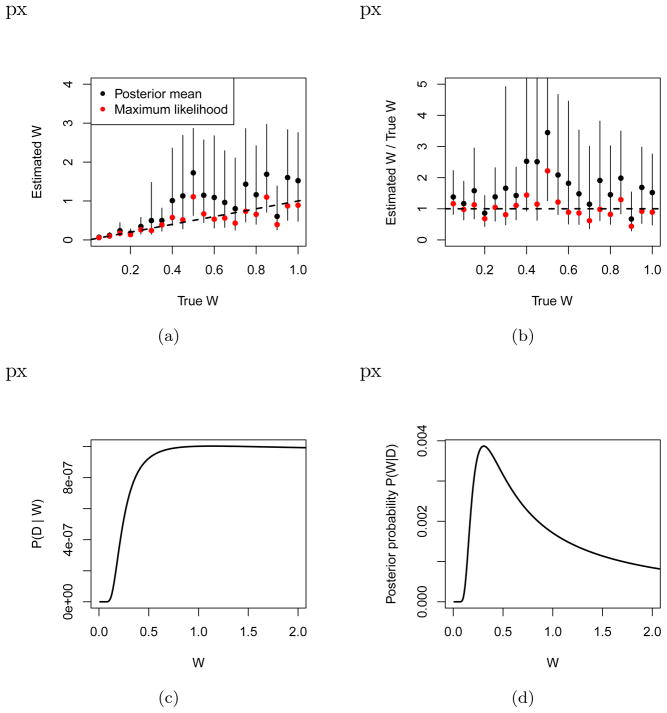
Figure 2.
(a) Values of W estimated from single simulated subjects at various true values of W, running 50 steps of a 2-up-1-down staircase design. Points show posterior mean (black) and maximum likelihood (red) fits to the data. Error bars show 95% highest posterior density intervals. The dotted lines represent y = x, corresponding to perfect estimation of W. (b) Same data on a proportional scale to show the relative error of estimate at each W. (c) The likelihood given by (1) on a simple data set, showing that high values of W all make the data approximately equally likely. There is little hope of accurately estimating high W. (d) This can be corrected by introduction of a weak prior exhibiting a clear maximum (here, a MAP value). Whether this maximum is inferentially useful is the topic of the next section.

