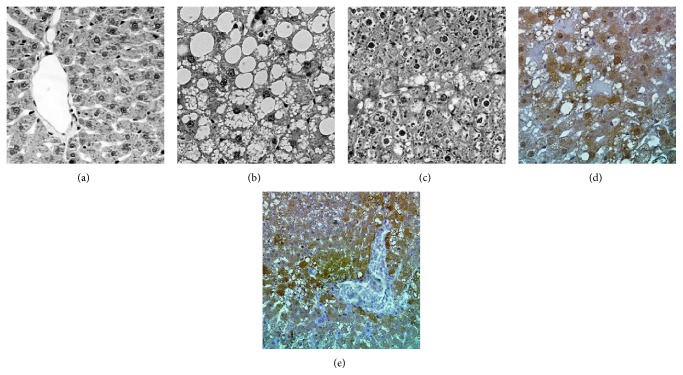
Figure 2.
Liver histology and immunohistochemistry. (a) Rats fed with standard diet (control group) at 30 weeks; normal histology, hematoxylin and eosin stain ×10. (b, c, d, and e) Rats fed a sucrose-rich diet (experimental group) at 30 weeks; (b) macro and micro vacuolar steatosis, and hepatocellular ballooning, hematoxylin and eosin stain, ×40; (c) macro and micro vacuolar steatosis, and hepatocellular ballooning, hematoxylin and eosin stain, ×10. (d) Intense reaction to malondialdehyde ×40; (e) reaction to leptin ×20.

