
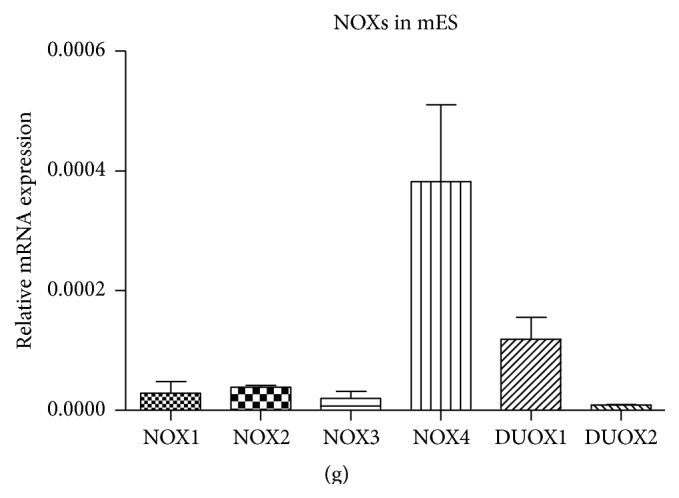
Figure 2.
Effect of APO (a) and DPI (b) on mES proliferation after 48 h treatment based on total cellular protein mass. Data represent mean + SEM from four independent experiments. Statistical significance was determined by ANOVA post hoc Bonferroni's Multiple Comparison test, P < 0.05. The groups marked differently by symbol letters are statistically significantly different from each other.