Figure 8.
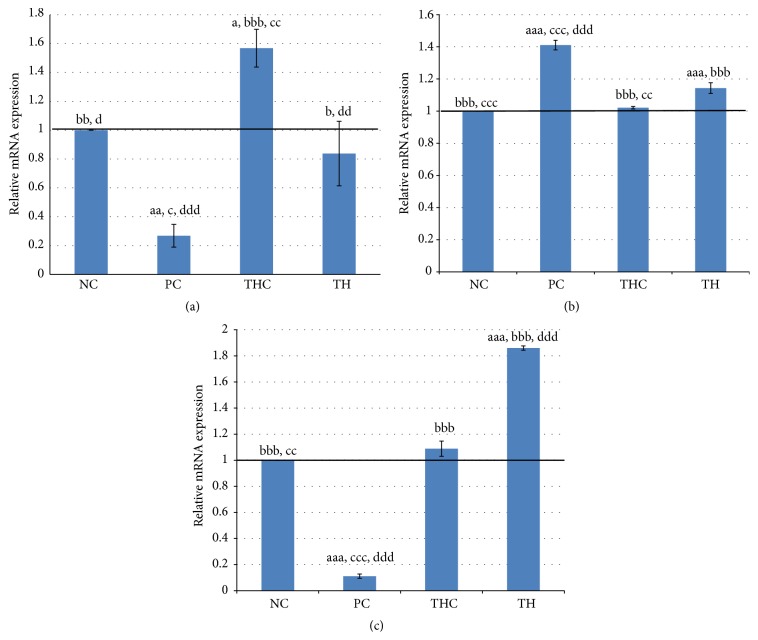
(a) Quantitative real-time PCR of ERα in all experimental groups. ERα mRNA expression was significantly downregulated in the rats exposed to BPA (PC group) (4-fold) as compared to the control animals (NC group). However, the decline was reversed (3-fold) by concurrent treatment with Tualang honey (TH group). Data are expressed as Mean ± SEM. (1) a P < 0.05 and aa P < 0.01 versus NC (negative control). (2) b P < 0.05, bb P < 0.01, and bbb P < 0.001 versus PC (BPA 10 mg/kg). (3) c P < 0.05 and cc P < 0.01 versus TH (Tualang honey 200 mg/kg + BPA 10 mg/kg). (4) d P < 0.05, dd P < 0.01, and ddd P < 0.001 versus THC (Tualang honey 200 mg/kg). (b) Quantitative real-time PCR of ERβ in all experimental groups. Compared to the control rats (NC group), the expression of ERβ was significantly upregulated (1.4-fold) in BPA-exposed rats (PC group) and this is reduced to 1.1-fold by concurrent treatment of Tualang honey (TH group). Data are expressed as Mean ± SEM. (1) aaa P < 0.001 versus NC (negative control). (2) bbb P < 0.001 versus PC (BPA 10 mg/kg). (3) cc P < 0.01 and ccc P < 0.001 versus TH (Tualang honey 200 mg/kg + BPA 10 mg/kg). (4) ddd P < 0.001 versus THC (Tualang honey 200 mg/kg). (c) Quantitative real-time PCR of complement C3 in all experimental groups. BPA exposure (PC group) caused a significant downregulation of the amount of complement C3 mRNA (9-fold) as compared to the control rats (NC group). This effect was completely reversed by concurrent treatment with Tualang honey (TH group). Data are expressed as Mean ± SEM. (1) aaa P < 0.001 versus NC (negative control). (2) bbb P < 0.001 versus PC (BPA 10 mg/kg). (3) cc P < 0.01 and ccc P < 0.001 versus TH (Tualang honey 200 mg/kg + BPA 10 mg/kg). (4) ddd P < 0.001 versus THC (Tualang honey 200 mg/kg).

