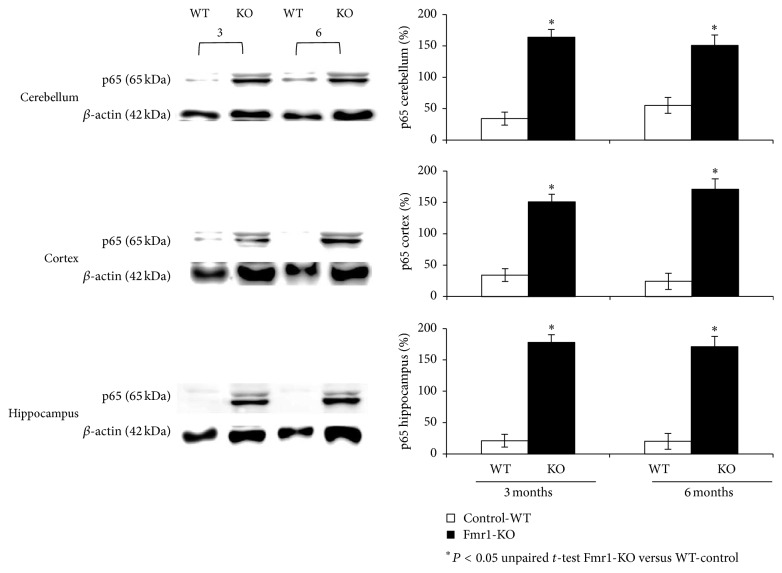
Figure 4.
Western blot analysis of p65 protein levels in the nuclear fraction of different brain areas, such as hippocampus, cortex, and cerebellum from fragile X mental retardation 1-knockout (Fmr1-ko) and wild-type (WT) mice of different ages. Densitometry analysis of specific bands expressed as percentage relative to WT samples (100%). β-actin levels were used as loading control. Molecular weight markers (kDa) are indicated on the left. Photographs are representative of six independent experiments. Data are described as the mean values ± standard deviation of six experiments (∗ P < 0.05 versus WT).

