
Figure 1.
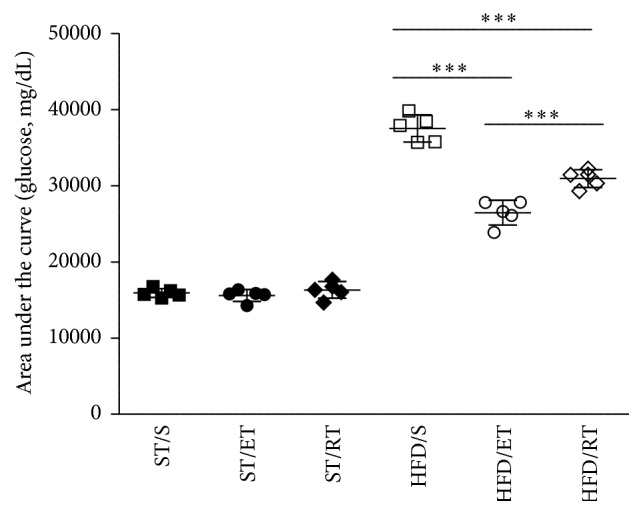
Area under the curve (AUC) of mean blood glucose (mg/dL) of mice fed standard chow or a high fat diet following an intraperitoneal glucose challenge. ST: standard diet, HFD: high fat diet, S: sedentary, ET: endurance training, and RT: resistance training. SD: standard deviation. For each group n = 5. ∗∗∗ p < 0.001, comparison within HFD groups: sedentary versus ET or RT and ET versus RT.