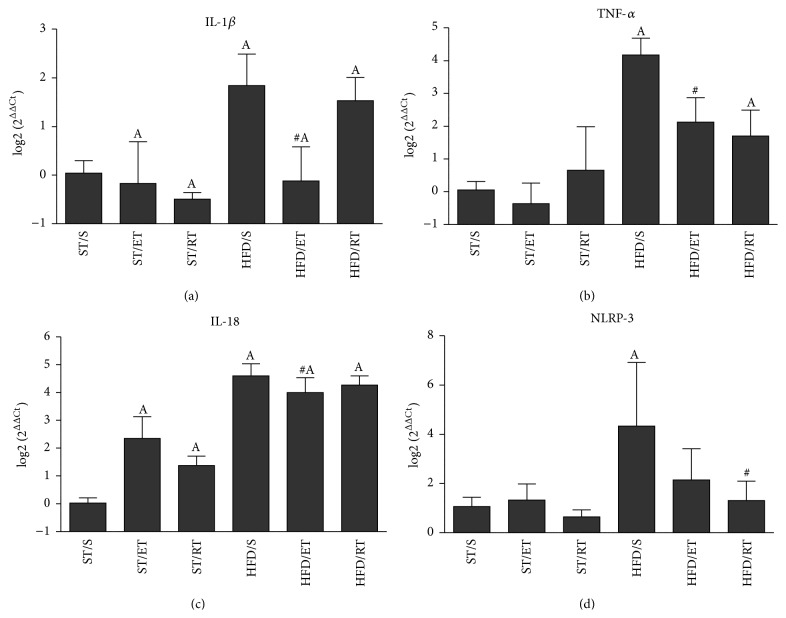
Figure 4.
Adipose tissue mRNA expression of IL-1β (a), TNF-α (b), IL-18 (c), and NLRP-3 (d) in sedentary and exercised groups of animals fed a standard or a high fat diet. Delta delta Ct (ΔΔCt) values were calculated by subtracting the mean ΔCt of ST/S (control) from the ΔCt of each examined sample. Statistical comparison was performed on ΔCt of each group. Data are shown as log2 (2ΔΔCt) values. A: comparison between ST diet groups and corresponding HFD group (p < 0.05), #: comparison between sedentary HFD group and the exercised HF groups, ST: standard diet, HFD: high fat diet, S: sedentary, ET: endurance training, and RT: resistance training.

