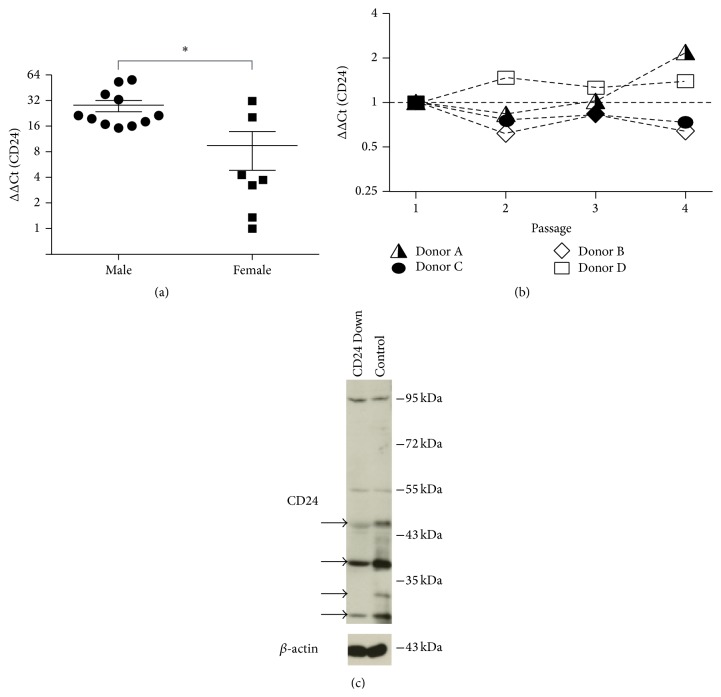
Figure 1.
Analysis of CD24 expression in hBMSCs. (a) hBMSC mRNA from 18 different donors in passage 2 of in vitro culture were analyzed for the expression of CD24 mRNA by qRT-PCR and analyzed for gender-dependent differences in mRNA expression levels. The relative expression values are plotted as fold change in mRNA expression (ΔΔCt) relative to the sample with the lowest relative CD24 mRNA expression. (b) The mRNA expression of CD24 was analyzed from passage 1 to passage 4 of in vitro culture in 4 individual donors. The expression values are normalized to the expression levels of the respective donor in passage 1 (ΔΔCt). (c) The expression of CD24 protein was evaluated by western blot with a polyclonal rabbit anti-CD24 antibody. In order to determine which bands were specific for CD24 hBMSCs were transduced with either a shRNA directed against CD24 mRNA (CD24 Down) or a scrambled shRNA (Control). Cell extracts from these two groups were then compared for CD24 reactive bands: the western blot bands with reduced intensity in the CD24 Down Group are marked with black arrows and represent bands specific for CD24. β-actin was used as loading control.

