Figure 2.
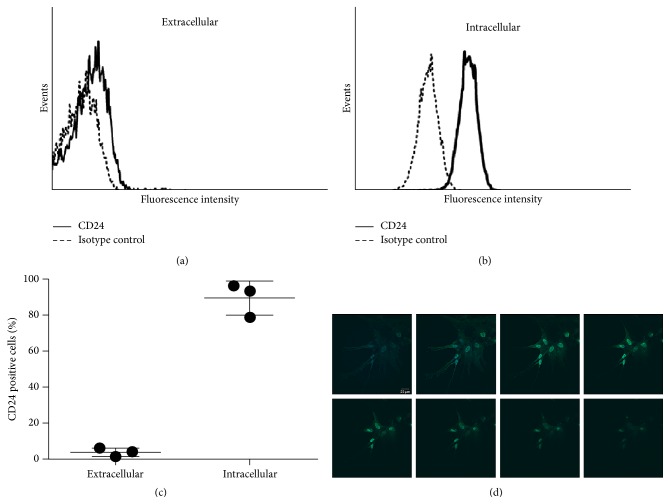
Cellular localisation of CD24. (a), (b), and (c) hBMSCs were analyzed by flow cytometry for the expression of CD24 protein. An exemplary histogram depicting the low extracellular CD24 expression can be found in (a); an exemplary histogram depicting the high intracellular CD24 protein density is shown in (b). (c) shows the percent expression of CD24 protein extra- and intracellularly in three independent experiments with hBMSCs from different donors. (d) Immunocytochemical analysis of the intracellular CD24 protein expression showing a diffuse cytosolic and a strong nuclear reactivity. A z-stack image is shown to highlight the nuclear localisation of CD24 (monoclonal anti-CD24 antibody, clone ML-5). Green = CD24. Blue = nuclear staining. Scale: 20 μm. A high resolution image of (d) can be found in Supplemental Figure 5.

