Figure 3.
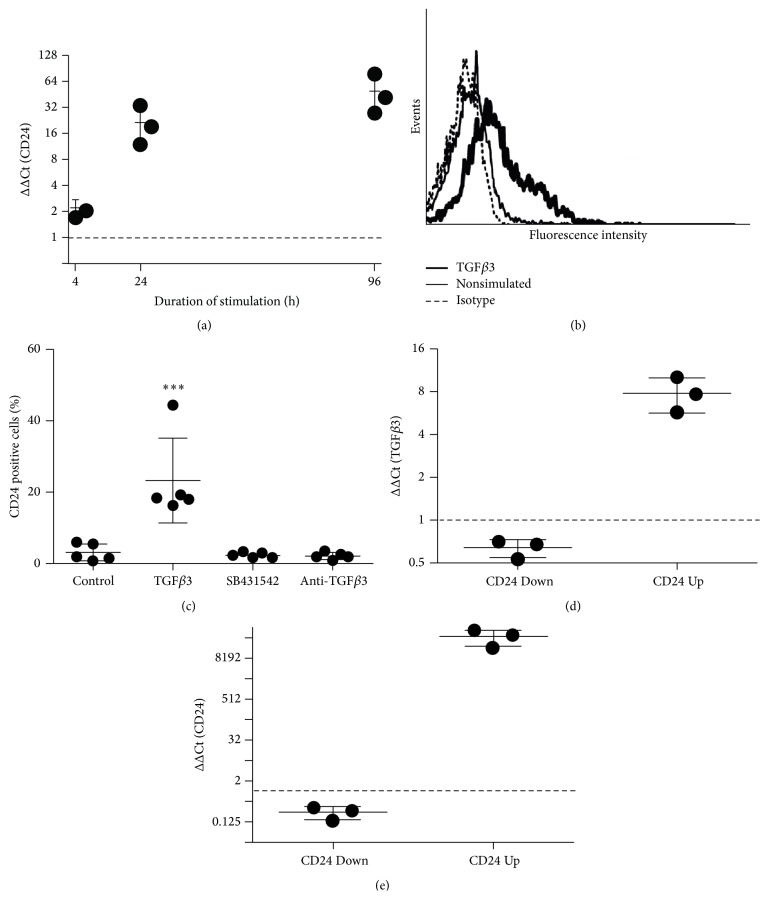
Reciprocal regulation of CD24 and TGFβ3. (a) qRT-PCR analysis of CD24 mRNA expression after stimulation with 10 ng/mL TGFβ3 for 4 h, 24 h, and 96 h relative to unstimulated control cells (ΔΔCt). (b) Exemplary histogram showing induction of CD24 surface expression after treatment with 10 ng/mL TGFβ3 or with 2.5 ng/mL TGFβ1 for 7 days as analyzed by flow cytometry. (c) Flow cytometric analysis of CD24 surface protein expression on hBMSCs after 7 days in unstimulated control cells (Control), in cells treated with 10 ng/mL TGFβ3 (TGFβ3), in cells treated with 10 ng/mL TGFβ3 + 20 μM SB431542 (SB431542), or in cells treated with 10 ng/mL TGFβ3 and 4 μg/mL anti-TGFβ3 antibody (anti-TGFβ3). (d) and (e) qRT-PCR analysis of TGFβ3 (d) and CD24 (e) mRNA expression after knockdown (CD24 Down) or overexpression (CD24 Up) of CD24 in hBMSCs after 7 days relative to respective control hBMSCs (n = 3 independent experiments with hBMSCs from different donors).

