FIGURE 6.
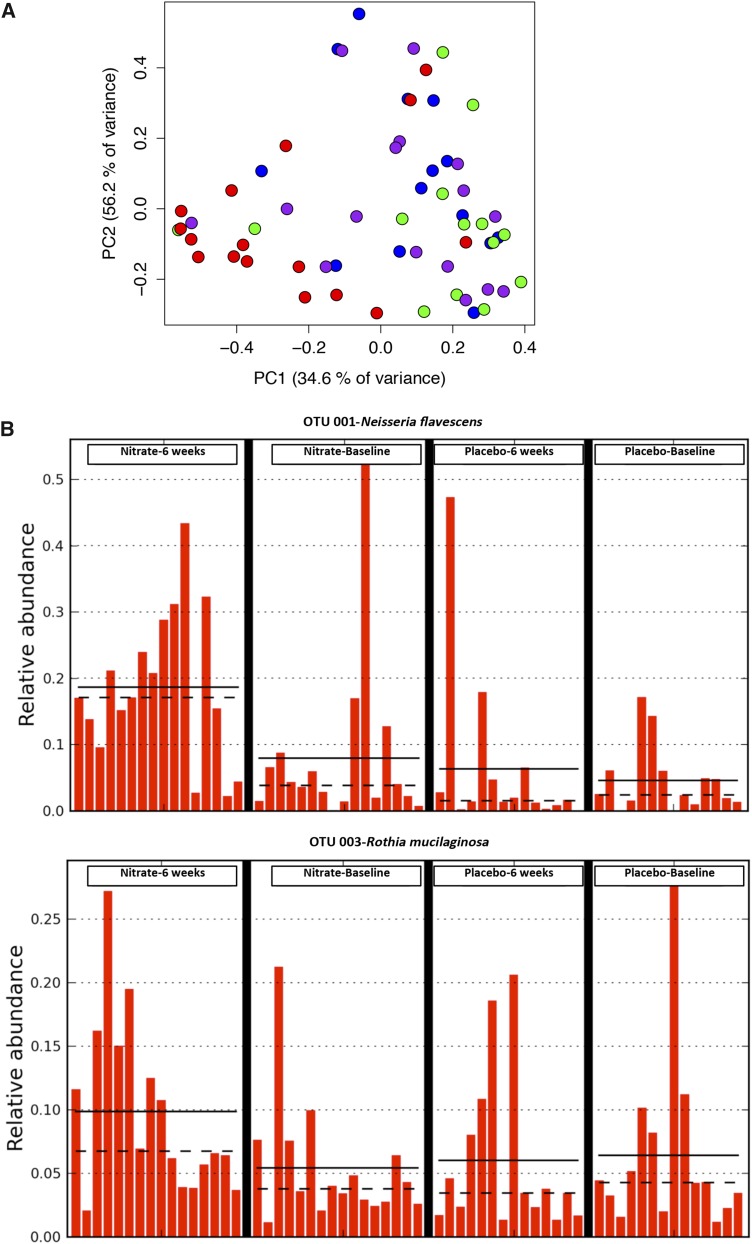
Dietary nitrate results in changes in the oral microbiome. The use of a bacterial community profile analysis by means of the mothur pipeline (16S ribosomal RNA gene) identified 78 different OTUs, the proportions of which were altered by dietary nitrate treatment. The statistical analysis was conducted with the use of an AMOVA (38) for assessment of the change between groups in the oral microbial community (39). The AMOVA gave P < 0.001 for the within-group comparison between baseline and post-nitrate and P = 0.001 for the between-group comparison of post-placebo compared with post-nitrate. Of these OTUs, those that had their numbers increase post-treatment and that made up >1% of the post-treatment community were Neisseria flavescens and Rothia mucilaginosa. (A) Plot depicts a principal coordinate analysis that was based on the ThetaYC metric, which compared the structure of the communities (PC1 = 34.6% of variance explained; PC2 = 56.2%). Colored circles represent the 2 groups of the study. Blue and green circles represent baseline and after 6 wk of placebo intake, respectively, and purple and red circles represent baseline and after 6 wk of once-daily intake (5 mmol) of dietary nitrate juice, respectively. (B) Representation of the relative abundances of R. mucilaginosa and N. flavescens at baseline and postnitrate or postplacebo treatment of 6 wk. Data are shown for baseline and 6-wk values for n = 16 in the nitrate group and n = 14 in the placebo group. Solid lines denote group means, and dotted lines denote group medians. AMOVA, analysis of molecular variance; OTU, operational taxonomic unit.

