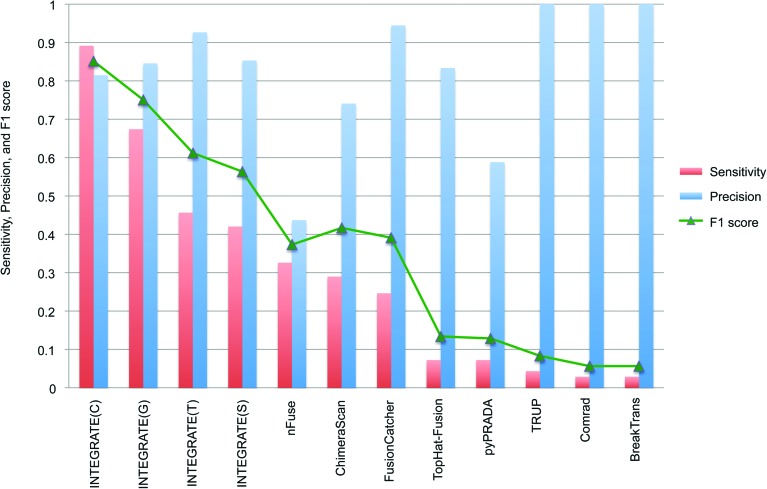
Figure 3.
Comparison of INTEGRATE and eight additional fusion calling methods. Sensitivity and precision (red bar and blue bar, respectively) of each method were calculated using a gold standard, which is the experimentally validated gene fusion called by nine methods, sorted in decreasing order of sensitivity. INTEGRATE applied with default parameters, using aligned reads generated by GSNAP, TopHat2, and STAR is indicated by G, T, and S, respectively. The combination of the three alignment tools is indicated by C. The accuracy, or F1 score, based on the combination of sensitivity and precision is shown with a green triangle.

