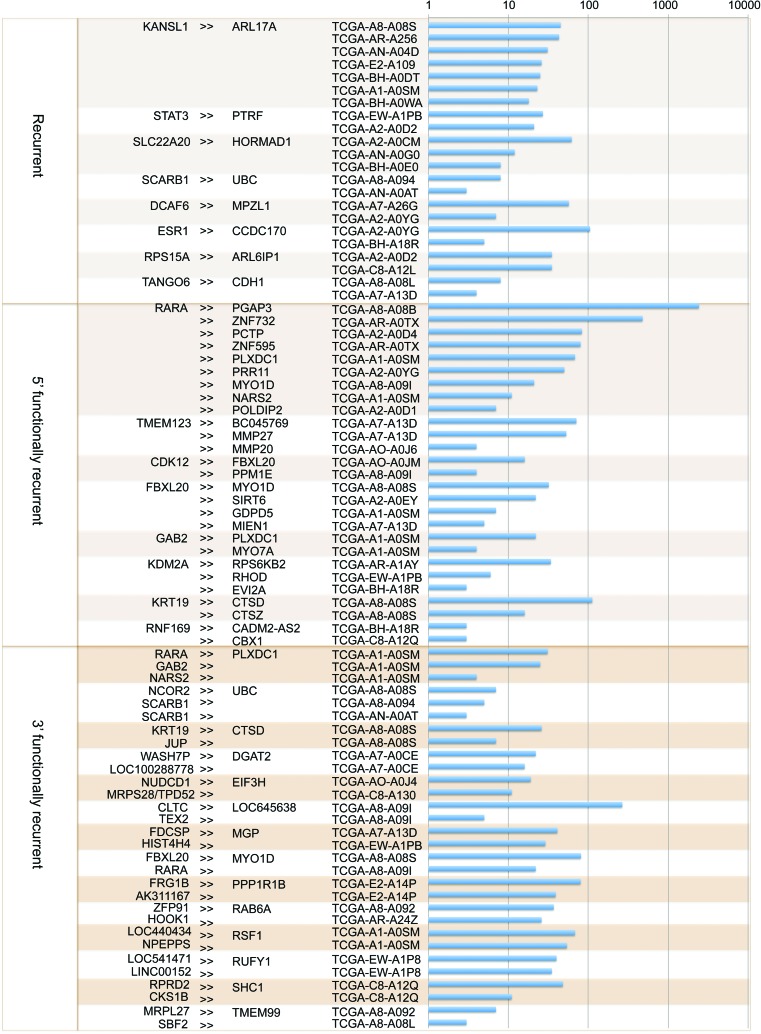
Figure 4.
Recurrent and functionally recurrent gene fusions in a TCGA 62 breast cancer patient cohort. Gene fusions are listed in the order of recurrent, 5′ functionally recurrent, and 3′ functionally recurrent. The first column shows the 5′ genes and the second column shows the 3′ genes. The third column is the TCGA names of the samples. Bar chart in the fourth column shows the log scale value of the quantity of supporting RNA-seq reads for each gene fusion.

